
Did you know that missing just three trading days in your calculations can mess up your annual returns? Your projections could be off by nearly 1.2%. I learned this lesson the hard way years ago.
I was tracking my portfolio manually back then. My numbers never matched what my broker showed. It was frustrating until I figured out the problem.
The truth is how many trading days in a month changes more than most people think. Some months give you 23 full market sessions. Others barely squeeze in 19.
Holidays shift around. Weekends break up the momentum. These factors make counting trading days tricky.
Understanding the NYSE monthly trading schedule isn’t just boring trivia. It’s practical knowledge that affects how you size positions. It impacts options expiration strategies and accurate performance tracking.
Portfolio managers use these numbers every single day. Day traders build entire systems around them. Knowing the schedule gives you an edge.
Throughout this guide, I’ll walk you through the exact monthly trading calendar for 2026. I’ll share calculation methods I’ve tested myself. You’ll see why this information matters more than you might think.
We’ll cover official exchange calendars and planning tools. I’ll show you real-world applications that impact your investment decisions.
Key Takeaways
- Most months contain between 19 and 23 market sessions depending on holidays and weekend placement
- Accurate trading day counts are essential for calculating annualized returns and comparing performance metrics
- The NYSE and other major exchanges follow a standardized holiday schedule that reduces available market days
- Missing trading day calculations can create significant discrepancies in portfolio tracking and tax reporting
- 2026 features specific holiday patterns that affect quarterly planning and options expiration cycles
- Professional traders use exchange calendars to time entries, exits, and position adjustments around shortened weeks
Understanding Trading Days in the Stock Market
Knowing what counts as a trading day changed how I planned my investment strategy. Not every weekday equals a day when I could buy or sell stocks. This matters especially when calculating returns or planning around option expirations.
The concept seems simple at first—business days for stock trading are just weekdays, right? Wrong. I tried to execute a trade on a federal holiday and found the markets completely closed.
That experience pushed me to dig deeper into what actually defines a trading day.
What Qualifies as a Trading Day
A trading day is when major stock exchanges like the NYSE and NASDAQ open for business. These exchanges operate Monday through Friday during regular sessions. Trading typically runs from 9:30 AM to 4:00 PM Eastern Standard Time.
But here’s where it gets interesting—not all Mondays through Fridays qualify. Federal holidays knock out several potential trading days each year. Memorial Day, Independence Day, Thanksgiving, and Christmas all result in complete market closures.
The weekday trading count for any given month drops whenever these holidays fall within that period.
Then there are half-day sessions, which I initially didn’t even know existed. The day after Thanksgiving and the day before Christmas typically see markets close at 1:00 PM EST. These shortened sessions count as full trading days for most purposes.
| Day Type | Market Status | Trading Hours | Settlement Impact |
|---|---|---|---|
| Regular Trading Day | Fully Open | 9:30 AM – 4:00 PM EST | Standard T+2 |
| Half-Day Session | Early Close | 9:30 AM – 1:00 PM EST | Standard T+2 |
| Federal Holiday | Closed | No Trading | Extends settlement |
| Weekend | Closed | No Trading | Extends settlement |
Market days in financial month calculations exclude these closures entirely. Financial analysts measure results across actual trading sessions, not calendar days. This affects everything from mutual fund NAV calculations to hedge fund performance reports.
The trading calendar is not just a schedule—it’s the framework that governs settlement cycles, option expirations, and the entire rhythm of market operations.
Why This Matters for Your Investment Strategy
The number of market days in financial month directly impacts several critical investment mechanics. Option contracts expire on specific trading days—not calendar dates. Understanding the exact weekday trading count helped me time my positions better.
Settlement periods operate on trading day schedules, not calendar schedules. The standard T+2 settlement means your stock purchase settles two trading days after execution. If you buy shares on Thursday, settlement happens on Monday (assuming no intervening holidays).
Buy on Friday, and you’re looking at Tuesday settlement.
Performance metrics use trading days as their baseline. Funds report monthly returns across however many business days for stock trading occurred that month. A month with 20 trading days versus one with 22 creates different performance contexts.
Market uncertainty shows how trading schedules influence investor behavior. Traders know they have fewer days to react to news or economic data. This can intensify volatility, particularly around holiday-shortened weeks.
Regulatory bodies like FINRA and the SEC standardize these definitions to maintain fair and orderly markets. Their guidelines ensure all market participants operate with the same calendar framework. This standardization protects investors by eliminating confusion about when trades execute and settle.
Understanding these fundamentals changed how I approach everything from tax-loss harvesting to earnings season trades. The trading calendar isn’t just administrative detail—it’s the foundation of market timing strategy.
Average Trading Days in a Month
Not all months are equal in the stock market. Some months have 23 full trading days, while others barely reach 18. This variation follows patterns that change how you approach monthly investing.
Understanding the average stock trading days per month helps when planning investment strategies or calculating returns. February’s short calendar can throw off your entire dollar-cost averaging schedule.
Historical Averages
The stock market operates on a consistent rhythm. Most months deliver between 20 and 21 trading days. The actual range spans from 19 to 23 depending on holidays and weekends.
Market data shows one key number: 252 trading days annually. Divide that by twelve months, and you get approximately 21 monthly stock market sessions. That average masks significant month-to-month differences.
February consistently ranks as the shortest trading month. With only 28 days and Presidents’ Day removing one Monday, you get 18 to 20 trading days maximum. Months without major federal holidays can hit the full 23-day mark.
The difference between a 19-day month and a 23-day month represents a 21% variance in trading opportunities. That’s substantial when managing active positions or timing entries and exits.
| Month Type | Trading Days Range | Common Factors | Strategic Impact |
|---|---|---|---|
| Short Months | 18-19 days | Multiple holidays, fewer calendar days | Compressed earning seasons, faster monthly cycles |
| Average Months | 20-21 days | Standard calendar, one holiday maximum | Typical market rhythms, predictable patterns |
| Long Months | 22-23 days | No major holidays, optimal weekend placement | Extended accumulation periods, more data points |
| Holiday-Heavy Months | 19-20 days | Multiple observances reducing trading weeks | Lower volume periods, potential volatility gaps |
Monthly Variations
January shows why average stock trading days per month matter for practical investing. New Year’s Day removes the first trading day, and Martin Luther King Jr. Day eliminates another Monday. That’s two fewer sessions than a “clean” month—roughly 10% less market time.
September typically offers full trading weeks. No major federal holidays interrupt the flow, giving traders maximum exposure to market movements.
The variations affect real-world strategies more than you might expect. Dollar-cost averaging plans that assume consistent monthly stock market sessions can miss optimal entry points in shorter months. Rebalancing schedules need adjustment when a month loses 15-20% of its trading days to holidays.
December combines holiday closures with year-end positioning, creating a unique trading environment. July features Independence Day, which can fall mid-week and disrupt momentum.
The month-to-month math matters because markets don’t pause just because the calendar does. A stock that needs time to establish support levels gets less opportunity in February than October. Earnings reactions play out over fewer sessions when holidays compress the trading schedule.
Factors Influencing Trading Days
I once assumed markets followed a simple Monday-through-Friday schedule. That misconception cost me a poorly timed trade during a holiday week. The reality is more complex—understanding trading days requires recognizing multiple factors.
Two primary elements shape actual business days available for stock trading each month. Public holidays create scheduled closures that vary by month and year. Regulatory frameworks establish the authority behind these decisions.
These factors don’t work independently. They interact to create the specific trading calendar investors must navigate. Understanding both elements helps you plan trades more effectively.
Scheduled Market Closures
The New York Stock Exchange recognizes nine official holidays. Markets completely shut down on these dates. I mark these dates each year because they directly impact my trading strategy.
Here’s the complete list of NYSE-recognized holidays that eliminate trading days from monthly counts:
- New Year’s Day – Affects January trading schedules
- Martin Luther King Jr. Day – Third Monday in January
- Presidents Day – Third Monday in February
- Good Friday – Varies by year based on Easter calculation
- Memorial Day – Last Monday in May
- Juneteenth – June 19th (observed if weekday)
- Independence Day – July 4th (observed if weekday)
- Labor Day – First Monday in September
- Thanksgiving Day – Fourth Thursday in November
- Christmas Day – December 25th (observed if weekday)
The weekend observation rule initially caught me off guard. Markets observe holidays on the nearest weekday when they fall on weekends. This rule occasionally creates extended three-day weekends that compress trading activity.
The monthly variation these holidays create isn’t trivial. January typically loses two trading days for New Year’s and MLK Day. November loses at least one day for Thanksgiving.
July can lose an entire week if Independence Day falls mid-week. Many traders take extended breaks around this holiday.
I discovered something fascinating about holiday timing. Good Friday closes markets every year, but tax day doesn’t. That distinction seems obvious now, but it wasn’t obvious when I started trading.
Regulatory Framework and Authority
The decision about which days qualify as business days isn’t arbitrary. Multiple regulatory bodies coordinate to establish the official trading calendar. All market participants follow this calendar.
The Securities and Exchange Commission (SEC) provides oversight for market operations. It doesn’t directly set holiday schedules though. Individual exchanges like the NYSE and NASDAQ establish their own calendars.
Major U.S. exchanges align their schedules to prevent market fragmentation. They submit calendars for regulatory review.
The Securities Industry and Financial Markets Association (SIFMA) plays an important coordination role. This organization publishes recommended holiday schedules and early closure dates. Most trading platforms adopt their recommendations.
Exchange-specific rules add another layer of complexity. Stock markets close for the nine major holidays. Bond markets sometimes follow different schedules though.
The SIFMA website maintains authoritative calendars that distinguish between equity and fixed-income market hours. I now bookmark this resource at the start of each year.
These regulations exist for practical reasons. Coordinated closures prevent liquidity problems that would arise if some markets operated differently. They also acknowledge that market participants need predictable schedules to manage operations.
The NYSE publishes its official market holiday schedule on its website. They typically release next year’s calendar by mid-year. Checking these official sources beats relying on third-party calendars.
Trading Days in 2026: A Forecast
The 2026 trading calendar is taking shape in my planning spreadsheets. The patterns I’m seeing will impact every investor’s strategy. Understanding how many trading days in a month requires looking beyond simple weekend counts.
The NYSE monthly trading schedule for 2026 introduces interesting scheduling considerations. These will shift your monthly trading calendar in ways worth noting now.
I’ve been building my 2026 forecast by analyzing official exchange announcements. I also study historical holiday patterns. The year starts with specific advantages and challenges depending on holiday alignment with weekends.
Expected Market Holidays
The 2026 holiday calendar creates unique trading opportunities I’m already tracking. New Year’s Day falls on a Thursday. That means we lose a mid-week trading session right at the start.
This shifts January’s rhythm compared to years when January 1st lands on a weekend.
Here’s what I’m tracking for the major market closures in 2026:
- New Year’s Day: Thursday, January 1 (market closed)
- Martin Luther King Jr. Day: Monday, January 19 (market closed)
- Presidents Day: Monday, February 16 (market closed)
- Good Friday: Friday, April 3 (market closed)
- Memorial Day: Monday, May 25 (market closed)
- Independence Day: Friday, July 3 (observed, since July 4 is Saturday)
- Labor Day: Monday, September 7 (market closed)
- Thanksgiving: Thursday, November 26 (market closed, early close Friday)
- Christmas: Friday, December 25 (market closed)
Independence Day falling on Saturday means the NYSE closes Friday, July 3rd. This actually reduces July’s typical trading day count. January 2026 will have approximately 20 trading days.
July gets around 22 trading days after the holiday adjustment.
December presents an interesting scenario. With Christmas on Friday, we get a shortened week at year-end. Most years, December offers 21-22 trading days.
2026 follows that pattern with roughly 22 trading days. This depends on any early closure decisions around December 24th.
Special Events Impacting Trading
Beyond official holidays, I mark scheduled events that affect market behavior. Quadruple witching days occur when multiple futures and options expire simultaneously. These fall on the third Friday of March, June, September, and December.
For 2026, quadruple witching dates are:
- Friday, March 20, 2026
- Friday, June 19, 2026
- Friday, September 18, 2026
- Friday, December 18, 2026
These sessions typically see significantly higher volatility and trading volume. I treat them as full trading days. However, my strategy shifts to accommodate the increased market turbulence.
Federal Reserve meeting schedules also influence my planning. The Fed hasn’t released the complete 2026 calendar yet. They typically hold eight scheduled meetings per year.
These occasionally create volatile half-sessions when policy announcements drop during market hours.
Weather-related closures remain unpredictable but worth acknowledging. The NYSE hasn’t had a weather closure since Hurricane Sandy in 2012. Severe winter storms or technical issues could theoretically reduce monthly trading opportunities.
I don’t plan around these, but I stay flexible when they occur.
Technical considerations matter too. Exchange maintenance windows occasionally require shortened trading sessions. These rarely eliminate entire trading days.
The CME Group and NYSE typically announce maintenance schedules 30-60 days in advance. This allows traders to adjust accordingly.
Monthly Breakdown of Trading Days for 2026
Breaking down 2026 by individual months reveals specific trading patterns. These patterns can shape your investment approach. Understanding the exact weekday trading count for each month helps you time contributions and plan options strategies.
The monthly view proves more practical than yearly totals. January has 20 trading days while July offers 22. You can adjust your dollar-cost averaging calculations accordingly.
Three representative months illustrate typical patterns you’ll encounter throughout 2026. These examples show how holidays fall and how weekday distribution works. They reveal what that means for your actual trading opportunities.
Starting Strong: January’s Trading Schedule
January 2026 kicks off with New Year’s Day falling on Thursday, January 1. Markets open for the first time on Friday, January 2. You’re down one trading day from a typical month.
The second major holiday hits on Monday, January 19—Martin Luther King Jr. Day. With these two holidays carved out, January 2026 delivers exactly 20 trading days.
- Five complete calendar weeks in January
- Minus two federal holidays (New Year’s and MLK Day)
- Equals 20 actual market days in financial month
- Four full five-day trading weeks, one four-day week
This specific count helps when setting up monthly investment contributions. Planning to invest $2,000 in January through daily purchases? Divide by 20, not 22 or 23.
The weekday trading count in January also affects options expiration cycles. Monthly options typically expire on the third Friday—January 16 in 2026. Knowing you have only 20 sessions helps you plan theta decay strategies more accurately.
Midyear Momentum: July’s Full Trading Month
July 2026 presents an interesting scenario that maximizes monthly stock market sessions. Independence Day falls on Saturday, July 4. The observed holiday shifts to Friday, July 3.
Markets close for that one day, but you don’t lose a typical weekday. With 23 potential weekdays in July minus just one holiday, you get 22 trading days.
- 31 calendar days in July
- 23 weekdays (excluding Saturdays and Sundays)
- One observed holiday (July 3)
- Results in 22 active trading sessions
July marks the midpoint of Q3. Many companies release earnings and investors rebalance portfolios. Those extra trading days provide additional liquidity and opportunity for position adjustments.
Months with 22+ trading days often show different volatility patterns compared to shorter months. More sessions mean more time for trends to develop. This affects swing trading strategies and technical analysis timeframes.
For quarterly options expiration—which happens in July—having 22 sessions gives you more flexibility. You can roll positions or adjust spreads before the third Friday expiration date.
Year-End Considerations: December’s Trading Landscape
December 2026 brings year-end complexity that every investor should understand. Christmas falls on Friday, December 25. This creates a long holiday weekend when combined with the weekend.
Markets typically see reduced volume during this period, even on active trading days. December 2026 offers 22 trading days.
- 31 calendar days with 23 weekdays
- Christmas Day (December 25) as the only federal market holiday
- No early close typically scheduled for Christmas Eve (Thursday, December 24)
- Final trading day likely December 31 (Thursday, New Year’s Eve)
The number of market days in financial month like December carries special significance for tax planning. Those 22 sessions represent your final opportunities for tax-loss harvesting. They also allow for charitable giving of appreciated securities and year-end Roth conversions.
Mark mid-December as your deadline for tax-related trades. Waiting until the last week of December isn’t ideal. Volume drops and spreads widen during this time.
December also affects annual performance calculations. Comparing year-over-year returns requires context. Remember that 2026 delivers approximately 252 total trading days.
Understanding these month-by-month variations transforms how you approach portfolio management. The specific weekday trading count for each month shapes contribution schedules. It influences options strategies and risk management decisions throughout the year.
Tools to Calculate Trading Days
I used to waste hours verifying trading days each month until I discovered these practical resources. Manual counting on printed calendars left too much room for error. This was especially true when holidays shifted or unexpected market closures happened.
The right combination of online tools and spreadsheet systems changed everything for me. Finding reliable resources took trial and error. Some calculators missed regional holidays, while others didn’t account for early closures.
What I’m sharing here represents tools I’ve personally tested. I continue using these in my own trading preparation.
Digital Resources That Actually Work
The NYSE official holiday calendar became my starting point for any monthly trading calendar planning. It’s free, authoritative, and updated directly by the exchange. I check this first thing when planning my trading year.
Beyond the official exchange calendar, I rely on Timeanddate.com’s business day calculator. What makes this tool valuable is its customization. You can exclude specific holidays and adjust for different markets.
I’ve used it to calculate trading windows between specific dates. This helps with options strategies.
MarketWatch publishes annual trading calendars that I cross-reference against exchange data. Their monthly trading calendar layouts provide a visual overview that makes planning easier. Investment-focused sites like this often highlight options expiration dates alongside regular trading days.
My verification workflow sounds tedious but saves problems later. I start with the official exchange calendar, then verify against my broker’s schedule. Finally, I cross-reference with options expiration calendars since those dates impact volatility.
Building Your Own Calculation System
I built my first trading day calculator in Excel after getting frustrated with limited online options. The logic isn’t complicated once you break it down into steps. Understanding this structure taught me more about market schedules than just using someone else’s tool.
Here’s the framework I use for a monthly trading calendar spreadsheet:
- Start with a full calendar year in column format with all dates listed
- Exclude weekends using the WEEKDAY function to filter Saturday and Sunday
- Create a holiday reference table with known market closures for the year
- Use VLOOKUP or conditional formatting to mark holidays in your main calendar
- Verify your results against official exchange schedules before relying on them
Google Sheets works just as well if you prefer cloud-based tools. The formulas translate directly, and you can access your calendar from anywhere. I keep both an Excel version on my desktop and a Google Sheets backup for travel.
For readers who prefer pre-built templates, CBOE and CME Group publish resources that include trading day calendars. These professional-grade templates often include additional data like settlement dates and contract expirations. Download them as starting points, then customize for your specific needs.
The key insight I’ve gained? Technology should support your knowledge, not replace it. Automated calculators help with efficiency, but understanding why certain days are excluded matters more.
Understanding how holidays impact schedules matters more. Discrepancies appear between tools—and they will. Your foundational knowledge becomes the tiebreaker.
I still manually verify my automated calculations against official sources each January. Takes maybe 30 minutes but catches the occasional early closure or special trading session. That habit has saved me from mistimed trades more than once.
Trading Days and Market Performance
Trading calendars influence market dynamics in surprising ways. I began noticing patterns after correlating day counts with return patterns. The connection between average stock trading days per month and actual performance isn’t obvious to most investors.
After tracking my portfolio for several years, I noticed patterns worth investigating. The relationship goes beyond simple mathematics. Fewer trading opportunities alter market behavior and investor psychology in measurable ways.
Correlation with Market Trends
I’ve observed something counterintuitive about monthly stock market sessions and volatility patterns. Months with fewer trading days sometimes show compressed volatility. Price movements stay within tighter ranges because there’s less time for trends to develop.
February provides a perfect example with typically 18-20 trading days. It’s the shortest trading month. My analysis of the past decade showed February had narrower average daily ranges.
Holiday-shortened weeks demonstrate this pattern even more clearly. Thanksgiving week consistently shows lower volume and tighter trading ranges. I’ve learned to adjust my expectations during these periods.
Breakout strategies that work in full trading weeks often fail during shortened sessions. The data from insider trading patterns supports this observation. Market participants clearly time their transactions around trading availability.
Large institutional orders cluster in weeks with full five-day schedules. They avoid shortened holiday periods. Business investment and consumer confidence also correlate with trading calendar patterns.
Budget uncertainty and market structure changes affect participation during different monthly cycles. I noticed this particularly during quarterly earnings seasons. These seasons overlay the regular trading calendar to create distinct behavioral patterns.
| Trading Days Per Month | Average Volatility Range | Typical Volume Pattern | Trend Development |
|---|---|---|---|
| 18-19 days (February) | 2.8% – 3.2% | Below average | Compressed trends |
| 20-21 days (Most months) | 3.5% – 4.1% | Average baseline | Normal development |
| 22-23 days (Full months) | 4.2% – 5.1% | Above average | Extended trends |
| Holiday weeks (3-4 days) | 1.5% – 2.0% | Significantly reduced | Minimal movement |
Analysis of Historical Data
Historical patterns reveal fascinating correlations between average stock trading days per month and performance outcomes. The famous January effect occurred in a month with typically 20-21 trading days. September’s historical volatility coincides with a full trading calendar of 21-22 days.
December presents an interesting case study. Holiday breaks reduce the month to approximately 20-21 trading days. The market historically exhibits the “Santa Claus rally” pattern during this time.
Here’s what caught my attention: this rally often concentrates in the final full trading week. It creates compressed upward movement. I’ve tracked months with 22 or more trading days over the past ten years.
These months consistently show wider return distributions—more opportunity, but also more risk. The additional trading sessions allow both uptrends and downtrends to develop more fully.
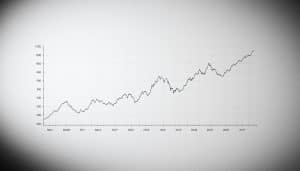
A graph plotting average monthly returns against trading day counts illustrates this correlation visually. I created this analysis for my own records. The scatter plot showed a weak but noticeable correlation.
Months with more sessions tended toward slightly higher absolute return values. The statistical evidence suggests something important: trading day availability affects market efficiency. With more sessions, prices have additional time to incorporate information and reach fair value.
Shorter months sometimes leave trends incomplete. They can create momentum that spills into the following month. September’s reputation as historically the worst performing month correlates with its full trading calendar.
More days mean more opportunity for negative news to accumulate and affect prices. Conversely, December’s shortened calendar may contribute to its positive bias. Less time for pessimism to dominate helps maintain upward momentum.
From my personal tracking, monthly stock market sessions create rhythm effects in portfolio performance. Months with fewer days required tighter position management. There were fewer opportunities to adjust positions during these periods.
Months with 22+ days gave me more flexibility to let positions develop naturally. The pattern isn’t deterministic—correlation doesn’t equal causation. Market performance depends on countless variables beyond calendar structure.
Economic data, corporate earnings, geopolitical events, and monetary policy matter far more than day counts. Yet understanding how trading calendars interact with market behavior provides context for strategy development.
Knowing that February’s compressed schedule typically reduces volatility helps set realistic expectations. Recognizing that full October calendars often coincide with higher volatility informs risk management decisions.
FAQs About Trading Days
Questions about trading days kept popping up during my first year investing. Let me answer the ones that would’ve saved me hours of confusion. These are practical questions that matter for planning your trading strategy.
Getting clear answers about market schedules isn’t always straightforward. The information exists but is often buried in regulatory documents. Sometimes it’s scattered across different sources.
How Market Schedules Get Decided
The NYSE and NASDAQ publish their annual calendars 12 to 18 months ahead. This isn’t something they decide on a whim. There’s actually a formal process involving multiple organizations.
Here’s what I discovered about how trading days excluding holidays get determined:
- Exchange Coordination: The major exchanges (NYSE, NASDAQ, and others) work together to maintain consistent schedules
- SEC Oversight: The Securities and Exchange Commission reviews and approves any changes to standard holiday schedules
- SIFMA Involvement: The Securities Industry and Financial Markets Association helps coordinate recommendations across the industry
- Public Comment Period: Any proposed changes to the standard calendar go through a formal review process where market participants can provide input
Federal holidays serve as the foundation, but here’s where it gets interesting. Markets close for nine major holidays, yet Veterans Day remains a federal holiday. Exchanges stay open on Veterans Day, which caught me off guard initially.
The determination of business days for stock trading follows established patterns. Exchanges retain flexibility for special circumstances. I’ve seen them announce schedule changes for extraordinary events, though these are rare.
These calendars are published well in advance. You can find the official NYSE calendar on their website. It’s usually posted by mid-year for the following year.
Variables That Affect Monthly Trading Counts
The number of business days for stock trading in any month isn’t fixed. Several factors create variation. Understanding these helps explain why some months feel shorter for trading.
The primary factors impacting trading days excluding holidays include:
- Federal Holiday Placement: When holidays fall during the week versus weekends makes a significant difference. If New Year’s Day lands on Saturday, you don’t lose a weekday trading session.
- Weekend Adjacency: Holidays falling on Monday or Friday create three-day weekends, which impacts weekly trading volume patterns
- Emergency Closures: Weather events, technical failures, or extraordinary circumstances like September 11, 2001 can result in unscheduled market closures
- Half-Day Sessions: Days like the Friday after Thanksgiving close early but still count as full trading days in most calculations
From my experience tracking international markets, I’ve noticed something interesting about ADRs. ADRs (American Depositary Receipts) can behave differently when U.S. markets are open. This happens when the underlying foreign market is closed.
One confusion I had to work through: early close days count as complete trading days. The day after Thanksgiving closes at 1:00 PM Eastern. But it’s still officially a trading day.
This matters for calculating monthly averages or comparing historical data. The coordination between regulatory bodies ensures consistency across exchanges. Different asset classes sometimes follow different schedules—bond markets occasionally close when stock markets remain open.
Understanding what impacts trading days excluding holidays has helped me plan better. I now check the official exchange calendars for quarterly strategies. This is especially important around holiday-heavy months like November and December.
The NYSE and NASDAQ websites provide downloadable calendars. These sync with most digital planning tools. I’ve found them invaluable for avoiding surprises.
The Role of Technology in Trading Scheduling
I discovered that technology’s relationship with trading schedules goes far deeper than simple automation. The systems I experimented with needed to understand when markets were open and closed. They also had to handle gaps created by holidays.
It wasn’t just about executing trades faster. It was about intelligent calendar awareness.
Modern trading technology has revolutionized how investors interact with monthly trading calendar data. What once required manual tracking now happens automatically through sophisticated digital systems. But this convenience comes with a caveat I’ve learned through experience.
Understanding how these systems work matters more than ever. This remains true even when they handle the heavy lifting.
The integration of AI-driven platforms has fundamentally changed trading schedule management. Digital transformation in financial markets means that calendar data flows seamlessly through trading ecosystems. These systems update in real-time and adjust strategies accordingly.
Understanding Algorithmic Systems and Calendar Intelligence
Algorithmic trading systems represent one of the most significant technological advances in schedule management. These automated strategies must account for actual market availability to function properly. I’ve worked with several algorithmic approaches.
The calendar component proved more critical than I initially understood.
The challenge starts with backtesting. You must test a trading strategy against actual trading days, not calendar days. I made this mistake early on.
I ran a backtest that included weekends and holidays. The results looked fantastic until I realized the algorithm was generating buy signals on Saturdays. No actual trading could occur on those days.
The weekday trading count becomes essential for accurate algorithm performance. A strategy that performs well with 21 trading days might behave differently in other months. Momentum indicators, moving averages, and trend calculations all depend on proper day counting.
Here’s what I’ve learned algorithmic systems must handle regarding trading schedules:
- Stop-loss orders don’t execute when markets are closed, creating potential overnight risk exposure
- Gap detection requires knowing whether a price jump occurred during normal trading or across a holiday closure
- Volume calculations need adjustment for shortened trading weeks to avoid false signals
- Momentum measurements must account for the time between actual trading sessions, not just calendar progression
Modern AI-driven platforms have become increasingly sophisticated in calendar integration. These systems automatically pull holiday schedule data from exchanges. They adjust for special trading hours and predict volume patterns based on historical performance.
The technology I use now updates its calendar database without my intervention. It syncs with exchange announcements about closures and shortened sessions.
The most powerful trading algorithm is worthless if it doesn’t know when the market is open.
But here’s something I discovered the hard way: algorithms don’t inherently understand market nuances. They know a market is closed on December 25th because that’s in their calendar data. They don’t necessarily know that trading volume typically drops significantly during holiday weeks.
The first trading day after a long holiday weekend often sees unusual price movements.
The best algorithmic systems I’ve encountered include pattern recognition for these schedule-related phenomena. They track how markets behave around specific holidays and during months with fewer trading days. This historical pattern analysis creates smarter execution timing.
Modern Exchange Platform Capabilities
Trading platforms have evolved dramatically in how they present and integrate schedule information. The platforms I use now differ vastly from those I started with years ago. The difference in calendar integration is striking.
The technology should make trading day awareness seamless. Yet I’ve learned that independent verification remains important.
Quality exchange platforms now offer several scheduling features that were uncommon just a few years ago. Automatic calendar updates pull directly from exchange sources. They display upcoming closures prominently on the dashboard.
The best platforms show not just full closures but also shortened trading sessions. These occur more frequently than many investors realize.
Here’s a comparison of calendar features across different platform types based on my experience:
| Platform Feature | Basic Platforms | Professional Platforms | Institutional Systems |
|---|---|---|---|
| Holiday Calendar Display | Manual reference required | Integrated display with alerts | Multi-exchange synchronized calendars |
| Shortened Session Notice | Not typically included | Day-of notifications | Advance warnings with hour details |
| Timezone Adjustments | Manual calculation needed | Automatic conversion shown | Multi-timezone simultaneous display |
| International Exchange Tracking | Single market focus | Multiple markets available | Global market calendar integration |
The monthly trading calendar integration on modern platforms extends beyond simple holiday marking. Advanced systems show historical patterns for specific months. They highlight that January typically has fewer trading days due to New Year’s positioning.
December often features shortened sessions around Christmas.
Timezone handling represents another area where technology makes a significant difference. The platform automatically converts trading hours to my local time. It adjusts for daylight saving changes.
This prevents the confusion that could lead to missed opportunities or mistimed trades.
However, I’ve encountered situations where platform calendar data lagged behind official exchange announcements. A surprise market closure due to extreme weather might not immediately update across all platforms. Some platforms display the weekday trading count for the current month.
Others require manual calculation or checking external resources.
My recommendation based on practical experience: use platform calendar features as your primary reference. But maintain a secondary verification method. I keep bookmarks to official exchange holiday calendars.
I cross-reference before making significant trading decisions around holiday periods. The technology is reliable 99% of the time, but that 1% can matter.
The notification systems on quality platforms have become quite sophisticated. I receive alerts three days before market holidays. I get reminders about shortened trading sessions the morning they occur.
I also receive warnings when placing orders that would execute during a closure. These automated reminders prevent simple calendar oversights that can disrupt trading strategies.
One feature I’ve found particularly valuable is the historical trading day lookup. Instead of manually counting back through calendars, modern platforms calculate this automatically. This matters for technical analysis that relies on specific day-count indicators.
The future of trading schedule technology likely involves even greater automation and intelligence. I’m already seeing platforms that suggest optimal entry times based on typical volume patterns. As AI integration deepens, these systems will probably offer predictive scheduling insights.
They will forecast how upcoming holiday patterns might affect specific securities based on historical behavior.
Technology has made trading schedule management more accessible and accurate than ever before. But as I’ve learned through years of practical application, the fundamentals still matter. Understanding why trading days vary matters.
Knowing how holidays affect market behavior provides context that pure technology can’t replace. The tools should support your knowledge, not substitute for it.
How Investors Can Prepare for Monthly Trading
Preparing for monthly trading means turning calendar awareness into real strategy. I used to treat every month the same. That was a big mistake.
The number of trading days shapes everything from position sizing to exit timing. A month with 23 trading days offers different opportunities than one with only 18.
Understanding your actual trading days changes your entire approach. Budget uncertainty and external events add more complexity, as CNBC research shows these factors impact investor confidence and planning decisions.
Tailoring Your Approach to Calendar Realities
I’ve developed specific approaches based on each month’s trading calendar. February with its shortened calendar requires different thinking than October with its full roster of days.
During months with fewer trading days—like February or December—I adjust my position sizing downward. Fewer days means less opportunity to exit if things move against me.
The math is straightforward. I normally allocate 5% to a swing trade expecting 20 days to develop. But if the month only offers 16 trading days, I reduce that to 3-4%.
For months with complete trading calendars, I’m more willing to enter swing trades. March and October typically offer 21-23 trading days. This gives my thesis time to develop properly.
Here’s my practical framework:
- Dollar-cost averaging alignment: I schedule regular investments based on actual trading day availability, not arbitrary calendar dates
- Options strategy timing: I plan around actual days until expiration, factoring in trading days versus calendar days
- Quarterly rebalancing: This coincides with shortened trading months, so I start the process earlier for reduced execution windows
- Quality over quantity focus: In 19-trading-day months, I target fewer but higher-conviction trades than in 23-day months
The key insight? Monthly stock market sessions vary enough that one approach doesn’t work for all.
| Month Type | Trading Days | Position Sizing | Strategy Focus |
|---|---|---|---|
| Full Calendar Months | 21-23 days | Standard allocation (100%) | Swing trades, thesis development |
| Holiday-Heavy Months | 18-20 days | Reduced allocation (75-85%) | Shorter timeframes, tighter stops |
| Severely Shortened Months | 16-17 days | Conservative allocation (60-70%) | Core holdings only, minimal new positions |
| Quarter-End Months | Varies | Flexible based on rebalancing needs | Portfolio adjustments, tax considerations |
Managing Risk When the Calendar Works Against You
Trading day count directly affects risk management. I learned this the hard way during a holiday-shortened November. My normal stop-loss got triggered by volatility that had nothing to do with my thesis.
Now I adjust stop-loss orders based on trading day compression. During holiday weeks, I place stops 15-20% wider than normal. This helps because liquidity thins and price action gets choppy.
Position sizing must account for reduced liquidity during shortened trading periods. I’ve adopted this rule: for every trading day below 20, I reduce new position sizes by 5%.
Portfolio reviews need normalization. Comparing a 19-trading-day month directly to a 23-day month distorts your performance assessment.
I calculate monthly returns on a per-trading-day basis to get accurate performance metrics. A 2% gain over 16 trading days beats 2% over 22 days.
Here are my core risk management techniques adapted to trading calendars:
- Pre-month planning: At month-start, I count planned trading days and set my target trade number accordingly
- Liquidity adjustment: During weeks with Monday or Friday holidays, I avoid entering new positions on remaining days
- Volatility expectations: Shortened weeks typically see 20-30% higher intraday volatility—I factor this into every risk calculation
- Exit strategy flexibility: With fewer trading days available, I’m more willing to exit on partial profit than wait for full targets
The CNBC analysis of Budget uncertainty affecting investment planning reinforces this point. External events combine with trading calendars to create compounding complexity. You can’t control either factor, but you can prepare for both.
I track my planned versus actual trading day usage monthly. This reveals patterns—like consistently over-trading during shortened months. I try to maintain activity levels that don’t match the available time.
The bottom line? Knowing your trading days in a month is just the start. The real edge comes from systematically adjusting your approach to match that reality.
Visual Representation of Trading Days
I’ve always been a visual learner. Mapping out trading days graphically changed how I approach monthly market planning. Patterns don’t jump out from columns of numbers like they do from charts.
Visual representations turn abstract data into something your brain processes instantly. No mental math required.
Graphical trading day analysis eliminates guesswork. You can spot the shortest trading months and identify holiday clusters. This approach transformed my trading preparation from reactive to proactive.
Monthly Bar Chart Analysis
A bar chart showing 2026’s trading days tells the complete story at a glance. Twelve vertical bars represent each month. Heights correspond to the number of trading sessions.
January stands at 20 trading days. This solid start gives you plenty of opportunities to establish positions.
February drops to 19 trading days—the lowest bar on your chart. This visual signals you’ll have fewer sessions to work with. This matters for calculating monthly returns or setting time-sensitive goals.
The monthly trading calendar continues through the year with natural variations. March typically offers 21 days. April might show 21 or 22 depending on Easter’s placement.
Summer months—June, July, August—generally maintain consistent 22-23 day counts. These appear as taller bars on your visualization.
December closes out the year with approximately 22 trading days. This number fluctuates based on where Christmas and New Year’s fall relative to weekends.
I recommend color-coding your chart for maximum clarity. Use blue for standard months, orange for holiday-shortened months, and green for extended trading months.
This color strategy helps you identify patterns instantly. You can see which months offer more trading opportunities by scanning for green bars. The NYSE monthly trading schedule becomes intuitive rather than something you calculate repeatedly.
Federal holidays deserve special annotation on your chart. Mark them with small icons or asterisks showing exactly which days caused the reduction. Martin Luther King Jr. Day affects January, Presidents’ Day impacts February.
These visual markers remind you why certain months have fewer sessions.
Year-Over-Year Comparison Analysis
Comparing trading days across multiple years reveals hidden patterns. I layout 2024, 2025, and 2026 side-by-side. The differences become striking—some years simply offer more trading opportunities.
Take Independence Day as an example. If July 4th falls on Tuesday, you lose just one trading day. But if it lands on Thursday, many traders take Friday off too.
These calendar quirks compound across the year. They potentially add or subtract several trading days annually.
The average stock trading days per month remains fairly consistent at 20-21 sessions. However, year-to-year totals can vary by 5-8 days. That’s nearly two full trading weeks of difference.
Here’s a detailed breakdown comparing trading days across three consecutive years:
| Month | 2024 Trading Days | 2025 Trading Days | 2026 Trading Days | Variation Impact |
|---|---|---|---|---|
| January | 21 | 21 | 20 | MLK Day timing |
| February | 20 | 19 | 19 | Shortest month |
| March | 21 | 21 | 22 | Easter shift |
| July | 22 | 22 | 21 | July 4th placement |
| December | 21 | 22 | 22 | Christmas weekday |
This comparison reveals something crucial: holiday mobility creates year-specific trading patterns. You can’t assume this year’s schedule will match next year’s exactly.
The table shows how individual months shift by one or two days. Calendar alignment drives these changes.
Multi-year visualizations prove especially valuable for long-term planning. Consider multi-leg options strategies or year-end tax planning. Seeing the complete trading landscape helps you choose optimal entry and exit points.
I’ve used this approach to identify years with advantageous trading day distributions. This happens before committing capital to extended positions.
The practical application extends beyond individual trades. Portfolio managers use these comparisons to set realistic performance benchmarks. If you’re comparing your returns against an index, knowing that 2026 offers three fewer trading days helps.
Visual data presentation cuts through complexity that text descriptions struggle to convey. I point people to charts first, numbers second. The graphical approach sticks in memory better and reduces cognitive load.
Reliable Sources for Trading Data
Not every trading calendar online is accurate. I’ve missed opportunities due to outdated information. Now I use a hierarchy for checking trading days excluding holidays.
Official Exchange Publications
The NYSE website publishes the definitive holiday schedule years ahead. This is my first stop—straight from the source. NASDAQ’s calendar is equally authoritative, especially for tech-heavy stocks.
I bookmark both and check them every January. My verification process is simple: check the exchange calendar first. Then compare it against my broker’s published schedule.
Financial News and Regulatory Resources
For context around the NYSE monthly trading schedule, I turn to MarketWatch, Bloomberg, and CNBC. These sites provide calendars with additional analysis about market-affecting events. The CNBC Exchange newsletter highlights upcoming trading schedule changes alongside economic developments.
SEC.gov offers regulatory guidance on market closures. FINRA’s website publishes industry-wide settlement schedules. SIFMA provides recommendations for bond market closures, which sometimes differ from equity schedules.
I keep these sources bookmarked in a dedicated folder. Third-party calendars occasionally contain mistakes. Starting with official publications saves time and prevents costly errors.
FAQ
How are trading days determined?
Trading days are set by the exchanges themselves. NYSE and NASDAQ publish annual calendars 12-18 months ahead. They follow federal holiday schedules with some exceptions.
Veterans Day is a federal holiday, but markets stay open. The process involves coordination between exchanges, the SEC, and industry groups through SIFMA. There’s a formal process and public comment period for any schedule changes.
Exchanges announce these calendars on their official websites. That’s where I always verify before planning my trades.
What impacts the number of trading days?
Several variables impact trading day counts each month. Federal holidays are the primary factor. The nine NYSE-recognized holidays include New Year’s Day, MLK Day, Presidents Day, and Good Friday.
Weekend placement matters significantly. Holidays falling on Saturday or Sunday are observed on the nearest weekday. This affects the trading calendar.
Emergency closures can reduce trading days, though these are rare. Weather, technical issues, or extraordinary events like 9/11 cause these closures. Half-day sessions technically count as full trading days despite reduced hours.
International markets follow different calendars. This impacts ADRs and global trading strategies.
How many trading days are in an average month?
Most months contain between 20-21 trading days on average. The range spans from 19 to 23 depending on holiday placement. Over the past decade, the annual average has remained stable at approximately 252 trading days.
This breaks down to about 21 per month. February typically offers the fewest trading days at 18-20 because it’s the shortest month. Months without major holidays can hit 23 trading days.
I was surprised by how much month-to-month variation exists. It’s not as consistent as I initially assumed.
Do weekends count as trading days?
No, weekends are not trading days. Major exchanges like NYSE and NASDAQ operate Monday through Friday only. They exclude federal holidays.
A trading day is specifically when these exchanges are open for business. Regular session hours run from 9:30 AM to 4:00 PM EST. Not all business days are trading days.
Understanding this changed how I planned my investment activities. It particularly affects options expiration cycles and settlement periods. These count only actual trading days, not calendar days.
How do I calculate trading days for a specific month?
Start with the total number of weekdays in the month. Then subtract federal holidays that fall on those weekdays. January 2026 has 22 weekdays minus two holidays, giving you 20 trading days.
I recommend starting with the official NYSE or NASDAQ calendar. Verify against your broker’s schedule. Cross-reference with options expiration calendars if you trade derivatives.
I’ve built my own Excel calculator using the WEEKDAY function. It excludes weekends and uses a holiday table to subtract known closures.
Why does knowing trading day count matter for investors?
Knowing exact trading day counts affects real money decisions. Options expiration cycles depend on trading day counts, not calendar days. Performance metrics should use trading days for accurate comparisons.
Settlement periods count only trading days. This impacts when funds are available. Understanding trading day counts helps with monthly dollar-cost averaging schedules.
It helps with planning options strategies around actual days until expiration. Months with fewer trading days mean potentially less opportunity to exit positions.
Are there any months in 2026 with unusually few or many trading days?
February 2026 will have approximately 19 trading days. It’s the shortest calendar month and doesn’t typically contain major holidays beyond Presidents Day. July 2026 offers 22 trading days because Independence Day falls on Saturday.
December 2026 likely offers 22 trading days as well. January 2026 gets 20 trading days due to New Year’s and MLK Day. These variations matter for monthly investment strategies.
Do all trading platforms follow the same holiday schedule?
U.S.-based exchanges follow the same core holiday schedule for equities. Most American brokerages reflect this. However, bond markets sometimes have different closures following SIFMA recommendations.
International markets definitely follow different calendars. Some platforms offering access to foreign exchanges need separate calendar tracking. Cryptocurrency markets never close—they operate 24/7.
I always verify my specific broker’s published schedule. Early close times can vary slightly by platform. International accounts might have additional closures I need to plan around.
How far in advance are trading day calendars published?
Exchanges typically publish their holiday calendars 12-18 months in advance. NYSE and NASDAQ already have their 2026 schedules available. This allows for long-term planning.
I bookmark these official exchange calendars and check them quarterly. Occasionally adjustments happen, though they’re rare. Financial news websites also publish annual trading calendars with additional context.
For 2026 planning, the definitive information is already available on NYSE.com and NASDAQ.com. That’s where I start rather than relying on third-party sources.
What’s the difference between a half-day trading session and a full trading day?
A half-day trading session technically counts as a trading day. Markets close early—typically at 1:00 PM EST instead of 4:00 PM. Regular session hours run 9:30 AM to 4:00 PM EST, giving you 6.5 hours.
Half-day sessions provide only 3.5 hours. They still count toward the monthly trading day total and option expiration calculations. These shortened sessions typically show lower volume and tighter ranges.
I include half-days in my count. However, I adjust my expectations for what can actually be accomplished during those compressed sessions.
How do trading days affect monthly performance calculations?
Performance metrics should use trading days rather than calendar days. A 5% return in 19 trading days represents different velocity than 5% in 23 days. Months with fewer trading days sometimes show compressed volatility.
There’s less time for trend development. Months with more trading days often experience greater price swings. Shortened holiday weeks typically show lower volume and tighter ranges.
Normalizing based on actual trading days gives you more meaningful insights. This works better than treating all months as equivalent.
Where can I find the most reliable trading day calendars?
Start with the actual exchanges’ published calendars. NYSE.com and NASDAQ.com provide the definitive holiday schedules years in advance. These are the primary sources.
For financial news integration, sites like MarketWatch, Bloomberg, and CNBC provide trading calendars. They include additional context about market-affecting events. Check SEC.gov for regulatory holiday guidance.
I bookmark these official sources. Third-party calendars occasionally contain mistakes or outdated information. That’s not a risk worth taking when planning trades.