
Gold can have three different values on the same day. Futures, spot markets, and local dealers may all quote different prices. This isn’t a glitch or manipulation, it’s just how precious metals markets operate.
Finding the current gold price per ounce isn’t simple. It’s not like checking a weather app. The market is complex and understanding it takes time.
Live gold spot prices on financial websites show a global market. However, these aren’t the prices you’ll pay for physical metal. There’s always a premium added to the spot price.
December futures recently settled with a 0.19% decline. Meanwhile, spot markets traded near $4,058. These price differences reflect changing investor sentiment due to US-China trade developments.
Key Takeaways
- Gold prices vary significantly between futures contracts, spot markets, and dealer premiums—sometimes by hundreds of dollars per troy ounce
- Recent trading shows December futures around $4,137.80 while spot markets hover near $4,058, reflecting different contract types and timing
- Spot prices represent immediate delivery value but aren’t what you’ll actually pay at bullion dealers
- The precious metals market operates 24/7 globally, causing constant fluctuation in quoted values
- Domestic Indian markets (MCX) show gold at Rs 1,23,451 per 10 grams, demonstrating regional pricing differences
- Understanding the distinction between contract types prevents comparing incompatible price quotes
Understanding Gold Pricing in Today’s Market
Gold price fluctuations are complex and respond to many forces. The quoted price reflects currency movements, geopolitical tensions, and other factors. Gold’s market behavior often seems counterintuitive at first glance.
Recent market action shows this complexity. We’ve seen profit-taking after a historic two-month bull run. This pushed gold to record territory before a temporary decline.
The selling pressure came from multiple sources. The US dollar index rebounded, typically pushing gold lower. Positive trade developments reduced economic uncertainty. The Gaza peace deal eased geopolitical tensions.
Despite these bearish factors, gold found support at lower levels. This is because Federal Reserve rate cut possibilities are still on the table. These possibilities lend strength to precious metals market trends.
The gold market is a barometer of fear and confidence, reacting not just to what happens, but to what investors believe might happen next.
The Major Forces Behind Price Movements
The “big three” influences on gold prices are dollar strength, inflation expectations, and geopolitical uncertainty. However, these are just the start of what affects gold prices.
The dollar correlation is very reliable in the precious metals market. When the dollar strengthens, gold typically weakens. This is because it becomes more expensive for foreign buyers.
Inflation expectations matter because gold serves as an inflation hedge. People often buy gold to preserve purchasing power when they expect prices to rise. However, actual inflation and expectations can differ greatly.
Geopolitical tensions create a “flight to safety.” Investors move capital into stable assets like gold during uncertain times. The recent Gaza peace deal removed some of this support.
Several other factors influence gold price fluctuations daily:
- Central bank policies and their gold reserve purchases or sales
- Physical demand from jewelry manufacturers and industrial users
- Investment flows through ETFs and futures markets
- Mining production and supply constraints
- Market sentiment and technical trading patterns
These factors don’t operate alone. They interact, amplify each other, or sometimes cancel each other out. This is exactly what we’re seeing in the current market environment.
Economic Indicators That Actually Matter
Not all economic indicators affect gold prices equally. Some create massive volatility, while others barely register. Understanding which ones matter most is crucial.
The Consumer Price Index (CPI) is the most important monthly data point for gold traders. It measures inflation directly. Any surprise can trigger significant price movements. Higher-than-expected inflation generally supports gold prices.
Employment reports are the second most important indicator. The monthly non-farm payrolls number gives insight into economic strength. It also influences Federal Reserve policy decisions. Strong employment can actually pressure gold lower.
Federal Reserve interest rate decisions are market-moving events. Lower rates reduce the opportunity cost of holding non-yielding assets like gold. Current speculation about potential Fed rate cuts is providing a floor under prices.
| Economic Indicator | Impact on Gold | Frequency | Market Reaction |
|---|---|---|---|
| Consumer Price Index (CPI) | Higher inflation supports prices | Monthly | High volatility |
| Federal Reserve Rate Decisions | Lower rates support gold | 8 times yearly | Extreme volatility |
| Non-Farm Payrolls | Strong employment pressures gold | Monthly | Moderate volatility |
| GDP Growth Reports | Strong growth can pressure gold | Quarterly | Low to moderate |
| Dollar Index Movement | Inverse correlation with gold | Continuous | Consistent influence |
Currency movements deserve special attention. They operate continuously, not just during scheduled data releases. The US dollar’s strength creates a constant underlying current for gold prices.
Psychology matters alongside hard economic numbers in the gold market. Sentiment, profit-taking, and technical chart levels can override fundamental factors in the short term.
Recent market evidence demonstrates this perfectly. After hitting record highs, gold experienced significant selling pressure from profit-taking. Traders who bought earlier decided to lock in gains. This selling momentum feeds on itself temporarily.
Trade developments also play a bigger role than many realize. Recent progress in US-China-India negotiations reduced economic uncertainty. This typically diminishes gold’s appeal as a safe haven. These geopolitical economic factors can shift quickly.
Understanding these indicators isn’t about predicting every gold price fluctuation. It’s about building a mental framework for why gold moves. When you grasp the underlying forces, market action starts making sense.
Gold pricing responds to a complex web of interconnected economic factors. Recent corrections after record highs aren’t anomalies. They’re the natural result of multiple influences creating selling pressure while other factors provide support.
Current Gold Price Per Ounce
Gold pricing data reveals shifting sentiment in precious metals. The market has been through quite a journey recently. Understanding today’s position requires examining both figures and underlying stories.
The precious metals market never sleeps. Prices can shift based on global events, currency changes, and investor mood. We’re seeing an interesting phase where profit-taking meets underlying strength.
Real-Time Market Data and Current Trends
Let’s look at today’s gold bullion rates. International gold December futures settled at $4,137.80 per troy ounce. This shows a 0.19% decline from the previous close.
24k gold value per troy ounce has similar price ranges. Slight variations depend on dealer premiums and purity checks. The purest gold typically costs more than spot prices.
The Indian market offers another interesting view. Gold December futures on MCX trade at Rs 1,23,451 per 10 grams. This is down 0.53% from the last session.
Here’s a detailed comparison of the current international and domestic pricing structure:
| Market | Commodity | Current Price | Daily Change |
|---|---|---|---|
| International | Gold (Dec Futures) | $4,137.80/troy ounce | -0.19% |
| International | Silver (Dec Futures) | $48.586/troy ounce | -0.24% |
| MCX India | Gold (Dec Futures) | ₹1,23,451/10 grams | -0.53% |
| MCX India | Silver (Dec Futures) | ₹1,47,470/kilogram | -0.70% |
The difference between international and domestic price changes is noteworthy. Indian market showed steeper declines. This often happens when local demand weakens or currency adjustments occur.
Manoj Kumar Jain of Prithvi Finmart provided key technical analysis:
Gold is holding at a crucial “make-or-break” level of $3,870, which represents a critical support zone for the precious metal.
This $3,870 level is more than a chart number. It’s where bulls and bears fight for control. Prices above could mean another rise. A break below might cause more profit-taking.
Putting Current Prices in Historical Context
Current prices follow a two-month rally to record highs. Gold exceeded $4,200 per troy ounce at its peak. This rally was driven by several factors.
Geopolitical tensions rose in many regions. Inflation stayed high despite central bank efforts. Most importantly, central banks became big gold buyers.
Gold’s value has grown 25-30% in the past year. This beat most traditional assets. It’s why gold became a top safe-haven choice again.
The recent drop doesn’t erase the uptrend. It looks more like a healthy pause. Markets need breaks after big moves like in January and February.
Key factors in gold’s recent price changes:
- Sustained central bank accumulation driving baseline demand higher
- Inflation concerns prompting retail and institutional investors to seek hedges
- Dollar weakness in certain periods amplifying gold’s appeal
- Geopolitical uncertainty creating recurring safe-haven flows
- Profit-taking after reaching psychological resistance near $4,200
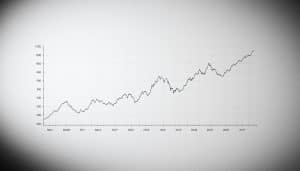
A year-long chart shows a clear upward pattern. The recent drop appears small in comparison. The rise was steep, so pauses are normal.
It’s interesting how opinions changed quickly when profit-taking began. News that drove buying suddenly became reasons to sell. This is typical market behavior.
Current volatility creates opportunities for different investors. Long-term holders aren’t worried by small drops. Traders see this as a chance for short-term strategies.
Factors Driving Gold Price Fluctuations
Gold trading rates are influenced by more than just supply and demand. Market mechanics and trader psychology play crucial roles. Recent corrections show how quickly sentiment can shift, even when fundamentals remain stable.
Multiple influences affect gold prices simultaneously. Strong demand might support higher prices. However, a geopolitical event can change everything within hours. This creates both opportunities and risks for precious metals traders.
The Push and Pull of Supply and Demand
Three major categories drive gold trading rates higher. Jewelry consumption is massive, especially in India and China. Gold is central to weddings and celebrations in these countries. Prices often rise during festival seasons due to increased demand.
Industrial applications provide steady demand. Electronics, dentistry, and aerospace industries all use gold. This demand doesn’t fluctuate much, but it supports gold trading rates consistently.
Investment demand can significantly impact prices. Bars, coins, ETFs, and futures contracts allow investors to gain gold exposure. When economic uncertainty rises, investment demand can outweigh jewelry and industrial consumption combined.
Supply comes from mining, recycling, and central bank activities. Mining production grows slowly, as new mines take years to develop. Existing operations face rising costs as easily accessible deposits get exhausted.
Recycling provides significant supply, especially when gold prices are high. Central banks have become net buyers in recent years. This has provided substantial price support by removing supply from the market.
Short-term price changes often reflect sentiment rather than fundamentals. Recent corrections weren’t due to increased production or decreased demand. They resulted from shifting perceptions of risk and opportunity in the market.
How Global Events Shape Price Movements
Geopolitical influences strongly drive gold prices. Wars, trade tensions, and political instability create uncertainty. Gold has served as humanity’s uncertainty hedge for thousands of years. The relationship is almost reflexive now.
The recent Gaza peace deal reduced geopolitical risk, contributing to gold’s weakness. Conversely, escalating tensions typically cause gold to rally hard. Prices can jump $50-100 per ounce within hours when major geopolitical news breaks.
Trade developments between major economies significantly impact gold prices. The US dollar index rebound and positive trade news triggered selling pressure. According to analysts, easing geopolitical tensions ended gold’s historic bull run and initiated a correction phase.
The market reprices quickly based on these developments. Professional traders monitor geopolitical risk constantly. Their algorithms can execute trades in milliseconds when news breaks. This creates rapid price movements that may seem disconnected from gold’s intrinsic value.
Currency movements add complexity to gold pricing. A stronger US dollar typically lowers gold prices. Gold becomes more expensive for buyers using other currencies. The recent dollar rebound contributed to gold’s correction as international demand softened slightly.
Recent weeks demonstrate these dynamics clearly. Gold retreated from record highs as geopolitical tensions eased and trade discussions progressed. This doesn’t represent a permanent shift. It shows how sensitive gold prices are to global stability perceptions.
Gold pricing can be seen as a negotiation between fear and confidence. Fear from wars, economic crises, or political chaos drives prices up. Confidence in alternative investments causes selling pressure. Neither state lasts forever, leading to oscillating gold prices.
Technical Analysis of Gold Prices
Gold price chart analysis often reveals market intentions before headlines catch up. Charts show the collective market’s current thinking. Combining technical and fundamental approaches gives an edge in timing gold positions.
The technical landscape for gold is at a critical point. A powerful rally followed by a sharp correction has occurred. The charts indicate where bulls and bears will clash next.
Technical analysis provides probability zones rather than certainties. It helps identify areas where risk-reward setups favor action or caution.
Key Chart Patterns to Watch
Manoj Kumar Jain at Prithvi Finmart highlights crucial technical levels for gold. These represent zones where buyers and sellers have shown strong interest. They create psychological and technical barriers.
Jain points to $3,870 per ounce as a “make-or-break” point for gold’s intermediate trend. A drop below could lead to accelerated selling pressure.
Here’s what the current technical landscape looks like:
| Metal | Support Levels | Resistance Levels | Unit |
|---|---|---|---|
| Gold (International) | $4,096 – $4,060 | $4,174 – $4,210 | Per Troy Ounce |
| Gold (Domestic India) | ₹1,22,650 – ₹1,21,400 | ₹1,24,200 – ₹1,25,100 | Per 10 Grams |
| Silver | $48.00 – $47.40 | $49.10 – $49.80 | Per Troy Ounce |
The chart pattern forming after the recent rally is crucial. Gold’s two-month surge hit unexpected levels. Now it’s in a consolidation phase.
The key question is whether this consolidation will break upward or downward. An upward break suggests trend continuation. A downward break could signal a reversal.
A bearish flag or consolidation triangle might be forming. Each pattern has different implications. Volume patterns are also important for confirming breakouts.
Indicators for Price Predictions
Several technical indicators provide confirmation signals. They help understand momentum, trend strength, and potential turning points. Together, these tools create a more complete picture.
The Relative Strength Index (RSI) is a key momentum oscillator. It can show overbought or oversold conditions. Moving averages provide dynamic support and resistance levels.
Here are the key indicators for gold price prediction analysis:
- MACD (Moving Average Convergence Divergence): This indicator helps identify momentum shifts by showing the relationship between two moving averages. When MACD crosses above the signal line, it suggests bullish momentum. Crosses below indicate bearish pressure.
- Volume Analysis: Price movements confirmed by strong volume are more reliable than those on light trading. I look for volume spikes at support or resistance levels to confirm breakouts or reversals.
- Fibonacci Retracement Levels: Many traders use these mathematical levels to identify potential reversal points during corrections. Common retracement levels include 38.2%, 50%, and 61.8% of the prior move.
- Bollinger Bands: These bands expand during volatility and contract during consolidation. When price touches the upper band, it may be overextended. Touches of the lower band can signal oversold conditions.
Technical analysis removes emotion from trading decisions. It responds to market actions rather than economic guesses. The best trades often come when multiple indicators align.
Beginners should avoid relying on just one indicator or pattern. Technical analysis works best as a system. Different tools should confirm each other.
The current gold setup represents a key decision point. Important support levels and mixed indicator signals are present. Bulls see healthy consolidation, while bears warn of exhaustion.
Wait for confirmation rather than predicting market breaks. Let the chart guide your actions. Set price alerts at key levels mentioned in the table above.
Use multiple tools like TradingView for charting and real-time data feeds. Regular check-ins with expert commentary help avoid bias. Ongoing chart analysis is a continuous process of updating understanding.
Predictions for Future Gold Prices
Forecasting gold prices requires data analysis and humility about uncertainties. Expert predictions and key factors can guide us in understanding future trends. Markets often humble even the most confident forecasters.
Separating wishful thinking from evidence-based analysis is crucial. We must examine expert forecasts carefully to make informed decisions.
Expert Forecasts and Projections
Manoj Kumar Jain predicts gold trading between $3,970 and $4,280 per troy ounce this week. This range shows significant volatility. His silver forecast expects prices between $46.50 and $51.50.
These projections are based on technical analysis and anticipated market reactions. They consider support and resistance levels in the market.
Three major events will drive short-term volatility:
- The US Federal Reserve’s monetary policy meeting and potential rate cut signals
- The meeting between US President Donald Trump and China’s President Xi Jinping in South Korea
- The European Central Bank’s policy review and its implications for global liquidity
Each event could swing gold prices significantly. Fed rate cuts are bullish for gold. Lower interest rates reduce the opportunity cost of holding non-yielding assets like precious metals.
The US-China dynamic is complex. A trade deal could be bearish short-term but supportive long-term. Initial market reactions often reverse within weeks.
Long-Term Trends to Consider
Structural factors supporting higher gold prices remain. These include global government debts, inflation concerns, geopolitical issues, and central bank buying. Gold has been in a bull market since 2019, with corrections along the way.
Some analysts project gold reaching $5,000+ per ounce within two years. Others see a trading range between $3,500 and $4,500 as more realistic.
Key factors to watch for long-term direction include:
- Central bank gold purchases (they’ve been net buyers for years)
- Real interest rates adjusted for inflation
- Dollar strength relative to other major currencies
- Debt-to-GDP ratios in developed economies
Volatility is a permanent feature in gold investment pricing. Even in bull markets, gold doesn’t move in a straight line. Expect 10-15% pullbacks before the next rise.
The fundamentals support continued upward pressure on prices. Currency debasement concerns and geopolitical uncertainty remain relevant. However, significant market choppiness is likely.
Stay informed about key drivers and maintain realistic expectations. The market will move regardless of individual forecasts. Approach predictions with caution and flexibility.
Tools for Tracking Gold Prices
I’ve tested many gold market tracking tools over the years. The best ones provide reliable, timely, and well-presented pricing data. Most fall short in at least one crucial area.
Useful tools offer actionable data without overwhelming you. They provide real-time updates, historical context, and functional alerts. These tools have proven their worth through consistent performance.
Best Online Platforms for Spot Price Monitoring
Kitco.com is my go-to for live gold spot prices. It updates every few seconds during market hours. The site offers decades of historical data and expert market commentary.
BullionVault excels at international pricing comparisons. It shows gold prices across multiple currencies and storage locations. This helps understand regional variations and decide where to hold physical gold.
GoldPrice.org offers clean, straightforward data. It displays prices in various weights and currencies without distractions. It’s ideal for quick spot price verification.
For Indian markets, Moneycontrol and Zee Business show MCX pricing alongside international rates. This helps compare import-based pricing with global spot markets. The Multi Commodity Exchange website provides official futures pricing.
COMEX (part of CME Group) sets the standard for international futures markets. Their pricing is widely referenced, but accessing the data requires technical knowledge.
Mobile Applications for Active Investors
The Kitco mobile app offers website features plus customizable price alerts. I use it to catch trading opportunities I might otherwise miss.
Gold Live! focuses solely on precious metals tracking. It updates in real-time and includes a portfolio tracker based on current gold prices.
JM Bullion and APMEX apps show actual buy/sell premiums from major dealers. This gives you real-world pricing instead of abstract market quotes.
The Bloomberg and Reuters apps include gold pricing within comprehensive market coverage. They’re useful for tracking correlations between gold and other asset classes.
Key features I prioritize in any tracking tool include:
- Update frequency of at least once per minute during market hours
- Historical charting with customizable timeframes from intraday to multi-year
- Price alerts based on percentage moves or absolute dollar amounts
- Multiple display options for different currencies, weights, and purity levels
- Portfolio tracking capabilities for monitoring your actual holdings
I always verify pricing across at least two independent sources before making significant trading decisions. Slight variations exist between platforms due to various factors.
Combining a primary website with a mobile app ensures comprehensive coverage. This strategy helps you stay informed and never miss important market movements.
FAQs About Gold Prices
Gold markets operate differently than most expect. These quirks stem from old trading conventions and modern global structures. Let’s explore the most common questions about gold pricing.
Understanding these basics impacts how you interpret prices and make investment choices. These details are crucial for both new and experienced investors.
What is Measured in Ounces?
Gold prices are always quoted in troy ounces, not regular kitchen ounces. A troy ounce weighs 31.1035 grams, while a standard ounce is 28.35 grams.
This 10% difference matters when dealing with expensive metals. The troy system dates back to Roman times and was standardized in medieval Europe.
When you see a 24k gold value per troy ounce of $2,650, it’s using this specific weight. All bullion and certificates use troy ounces or metric weights for larger amounts.
Here’s a quick comparison:
| Measurement Type | Weight in Grams | Common Usage | Difference from Troy |
|---|---|---|---|
| Troy Ounce | 31.1035 | Precious metals (gold, silver, platinum) | Baseline standard |
| Avoirdupois Ounce | 28.35 | General goods, food items | 8.9% lighter |
| Metric (for reference) | Varies | International standard for most goods | Used alongside troy |
When buying gold, dealers always use troy ounces. Always ask for clarification if it’s not specified. The 10% difference can mean big money on large purchases.
How Are Prices Established Daily?
Gold trades nearly 24 hours a day across global markets. Prices change constantly based on supply and demand in major cities worldwide.
The London Bullion Market Association (LBMA) sets key benchmarks twice daily. This happens through an electronic auction with major banks and market makers.
In the US, COMEX gold futures drive real-time pricing. The spot price you see comes from the most active near-term futures contract.
Local gold rates factor in currency exchange, import duties, and regional demand. Here’s a guide for checking prices accurately:
- Check the timestamp – Prices during active trading hours (roughly 8:00 AM to 5:00 PM ET for US markets) are most reliable
- Note the source – Reputable sites pull data from COMEX, LBMA, or direct exchange feeds
- Weekend caution – Prices displayed on Saturday or Sunday may be stale or based on thin overnight trading
- Compare multiple sources – Slight variations between sites are normal due to bid-ask spreads and data feed timing
- Understand premiums – Dealer prices for physical gold include premiums above spot for fabrication, distribution, and profit margins
Gold futures pricing shows market expectations for months ahead. Global events can influence prices across time zones. Asian demand affects New York prices hours later.
The “bid” price is what dealers pay for gold. The “ask” is what they sell it for. The difference is their profit margin.
When you see a 24k gold value per troy ounce, it’s usually the spot ask price. Always clarify which price you’re looking at for accurate comparisons.
Investing in Gold: A Guide
Gold investments offer unique benefits and hidden costs. Your choice impacts liquidity and risk exposure. Understanding these differences can lead to solid returns or disappointing losses.
The spot price is just the starting point. Premiums, fees, storage costs, and taxes affect actual returns. The precious metals market now offers more options, but it’s also more complex.
Let’s explore the investment landscape based on my experience. Each approach suits different goals, risk tolerances, and time horizons.
Different Ways to Invest in Gold
Physical gold is straightforward. You buy coins, bars, or jewelry and take possession. It provides comfort during crises. Tangible value offers peace of mind that paper assets can’t match.
But physical gold has challenges. You’ll pay premiums over spot price, typically 3% to 10%. Bullion coins offer recognizability and lower premiums. Storage decisions come with costs and security trade-offs.
Selling physical gold can be tricky. Dealers often buy back below spot price. You need to find reputable buyers. Liquidity isn’t as instant as selling stocks.
Gold ETFs solve many physical hassles. They let you buy shares representing gold in secure vaults. You get exposure without worrying about storage, insurance, or buyers. Trading happens during market hours with tight spreads.
Convenience comes at a cost. Annual fees typically run 0.25% to 0.40%. Over decades, it adds up. There’s also counterparty risk. You’re trusting the fund structure, not holding the metal yourself.
Futures and options offer leveraged exposure but carry higher risk. They allow control of large amounts with small capital. Professional traders use these, but they’re dangerous for beginners.
I advise against futures unless you have substantial experience. Losses can exceed your initial investment. The complexity requires education most casual investors don’t have.
Gold mining stocks and ETFs provide indirect exposure. You’re betting on companies that extract gold. These can outperform physical gold during bull markets. When gold prices rise, mining profit margins expand dramatically.
But mining stocks carry company-specific risks. Management decisions, costs, disputes, and regulations affect performance. Gold can rise while certain stocks fall due to operational issues.
Digital gold platforms let you buy gold in tiny increments. This makes dollar-cost averaging easy. The platform stores the gold and handles custodial arrangements.
The convenience is clear, but you’re trusting the platform’s solvency. Do your research on the company’s reputation and practices. Read the fine print about redemption terms and fees.
| Investment Type | Liquidity | Annual Costs | Best For |
|---|---|---|---|
| Physical Gold (Coins/Bars) | Low to Moderate | Storage + Insurance (1-3%) | Crisis protection, long-term holders |
| Gold ETFs (GLD, IAU) | High | Management Fees (0.25-0.40%) | Liquid exposure, portfolio allocation |
| Futures (MCX, COMEX) | Very High | Commissions + Margin Interest | Experienced traders, hedging strategies |
| Mining Stocks/ETFs | High | Management Fees (0.35-0.55%) | Growth potential, higher risk tolerance |
| Digital Gold Platforms | Moderate | Platform Fees (0.5-1.5%) | Small investors, dollar-cost averaging |
Risk Management Strategies
The biggest mistake is overallocating to gold. Most advisors suggest 5% to 15% maximum of your portfolio in precious metals. Gold doesn’t generate income like stocks or bonds.
Following market trends helps with timing, but catching bottoms and tops is futile. Dollar-cost averaging works better. Buy consistent amounts regularly regardless of price. This smooths out volatility and removes emotional pressure.
Recent market behavior shows how quickly sentiment can shift. Sharp corrections happen even within strong uptrends. Lump sum investments at the peak can hurt financially and psychologically.
Diversification within gold investments adds protection. I hold both physical gold and ETF positions. Physical serves as crisis insurance. ETFs offer flexibility to rebalance and take profits.
Setting clear profit-taking and stop-loss levels matters for active trading. I learned this during the 2011-2013 correction. Now I establish targets before entering positions and stick to them.
Your time horizon shapes your risk management approach. Gold can underperform during strong equity bull markets. From 2013 to 2018, gold stagnated while stocks soared.
Recent volatility underscores why risk management remains essential. Gold protects against certain risks but creates others. Proper strategies turn gold into a genuine portfolio component serving its purpose.
Historical Gold Price Trends
Gold prices have fluctuated over decades. These changes offer insight into current trends. Understanding past patterns helps predict future movements.
Historical movements reveal more than numbers. They show how human psychology and economic forces interact during uncertain times.
Major Turning Points That Shaped Gold’s Journey
Gold was tied to currency values until 1971. The Bretton Woods system fixed gold at $35 per troy ounce from 1944 to 1971.
President Nixon ended dollar-gold convertibility in August 1971. This change unleashed gold into a free market. Prices soared to $850 by January 1980.
The $850 peak equals about $3,200-$3,500 in today’s dollars. Recent levels around $4,137 represent genuine all-time highs, even adjusted for inflation.
Gold entered a bear market after 1980, lasting two decades. It bottomed around $250-$280 between 1999 and 2001. Central banks sold reserves, and the tech boom diverted investment.
| Year | Price Event | Key Driver | Inflation-Adjusted Value |
|---|---|---|---|
| 1971 | $35/oz fixed price ends | Nixon ends gold standard | ~$260 in 2025 dollars |
| 1980 | $850 peak | Inflation + geopolitical crisis | ~$3,200-$3,500 today |
| 1999-2001 | $250-$280 bottom | Central bank selling + tech boom | ~$450-$500 today |
| 2011 | $1,900 high | Financial crisis aftermath | ~$2,600 today |
| 2024-2025 | $4,137 record high | Multiple factors converging | Current dollars |
The 2000s brought a new bull market. Gold surpassed its 1980 nominal high in 2008. It reached $1,900 in September 2011 due to financial crisis aftermath.
A correction period followed from 2011 through 2019. Gold traded mostly between $1,100 and $1,400. This frustrated long-term holders expecting continuous gains.
How Economic Crises Changed Gold’s Trajectory
Past economic crises show gold’s role as crisis insurance. Each major downturn created distinct patterns worth understanding.
During the 2008 crisis, gold initially dipped with other assets. It then rallied as the Federal Reserve slashed rates and implemented quantitative easing.
The COVID-19 crash in March 2020 followed a similar pattern. Gold briefly sold off, then surged to new highs above $2,000.
Key crisis responses that drove gold higher include:
- Massive monetary expansion – Central banks printing money devalues currency and boosts gold appeal
- Near-zero interest rates – Lower opportunity cost makes non-yielding gold more attractive
- Flight to quality – Investors abandon risky assets for time-tested stores of value
- Currency devaluation fears – Stimulus programs raise inflation concerns that benefit gold
The current bull phase began around 2019. It accelerated dramatically with COVID-19 in 2020. Gold reached record nominal highs in 2024 and early 2025.
Gold has posted positive returns in 70-75% of years since 1971. This average masks significant year-to-year volatility. Some years see 30% gains, others experience 20% losses.
Studying these trends helps recognize patterns without assuming history repeats exactly. Drivers change, but investor psychology remains consistent. Fear and uncertainty push people toward tangible assets they trust.
A logarithmic chart from 1970 to present shows major gold phases. It illustrates the 1970s spike, 20-year bear market, and current phase. Each era had distinct characteristics linked by gold’s appeal during uncertainty.
Importance of Gold in an Investment Portfolio
I once dismissed gold as outdated. Market cycles proved me wrong. Gold’s value lies in diversification and risk mitigation during specific market environments.
Statistics support this role convincingly. Gold often shows low to negative correlation with stocks and bonds. It tends to rise when traditional assets fall.
This inverse relationship makes gold valuable in asset allocation. During major equity bear markets, gold often held steady or appreciated significantly.
Diversifying with Precious Metals
Silver, platinum, and palladium offer additional exposure with different demand drivers. Gold remains the core precious metal due to its liquidity and monetary role.
Evidence suggests a 5-10% allocation to gold and precious metals can reduce portfolio volatility. It can also maintain or improve long-term returns.
Studies show portfolios with gold exposure had lower drawdowns during crises. Don’t go overboard with allocation. Beyond 10-15%, you may sacrifice returns during normal market conditions.
Rebalancing is crucial when working with gold. It allows you to trim positions and lock in gains during rallies. When gold underperforms, rebalancing forces you to buy low.
Here’s a practical guide for incorporating gold investment pricing into portfolio decisions:
- Start with clear objectives: Decide whether you want portfolio insurance or speculation opportunities
- Use cost-effective vehicles: ETFs typically work better than physical gold for most of your allocation
- Maintain discipline around targets: Set your allocation percentage and stick to it through rebalancing
- Think long-term: Gold is a diversifier, not a trading vehicle for most investors
- Monitor central bank activity: Their buying patterns often signal important precious metals market trends
Traditional stock-bond diversification may be less reliable now. Both asset classes respond similarly to inflation and interest rate changes. This potentially enhances gold’s diversification value.
Historical Returns vs. Other Investments
Comparing historical returns reveals gold’s characteristics clearly. The numbers tell a story every investor should understand before making allocation decisions.
Over decades, stocks have outperformed gold substantially. From 1971 to 2025, the S&P 500 delivered 10-11% annualized returns versus gold’s 8-9%.
| Investment Type | Annualized Return (1971-2025) | Best Decade Performance | Correlation with Stocks | Primary Risk Factor |
|---|---|---|---|---|
| Gold | 8-9% | 2000s (300%+ gain) | Negative to low | Opportunity cost |
| S&P 500 Stocks | 10-11% | 1990s (400%+ gain) | 1.0 (baseline) | Market crashes |
| Investment Grade Bonds | 6-7% | 1980s (high rates) | Low to moderate | Inflation erosion |
| Real Estate (REITs) | 9-10% | 2010s (recovery) | Moderate | Interest rate sensitivity |
Over specific periods, gold has dramatically outperformed everything else. The 2000s saw gold crush stocks while bonds offered steady returns. Your investment timeline matters for gold investment pricing decisions.
Bonds offer steadier, lower returns than gold and stocks. They provide income through interest payments, which gold can’t do. They serve different portfolio functions.
What matters is how these assets work together in a portfolio. During the 2008 crisis, gold rose 5% while stocks fell 40%. This negative correlation protected portfolios effectively.
A 5-10% gold allocation can cushion the blow when everything else collapses. Losing 5% on gold while gaining 20% beats losing 40% across your entire equity position.
Current precious metals market trends suggest diversification matters more than usual. Central banks are buying gold at historic rates, creating fundamental support.
Gold investment pricing shouldn’t be about timing the market. It’s about building a portfolio that survives various economic environments. Gold fills a specific role that becomes obvious when you need it most.
Gold Price Statistics and Graphs
Gold price charts reveal fascinating trends over the past decade. Visual data shows patterns that descriptions alone can’t capture. Let’s explore what the numbers tell us about gold investments.
Recent market data shows interesting figures. Gold December futures settled at $4,137.80, down 0.19%. This follows a two-month rally that pushed gold to record highs above $4,100 per troy ounce.
Silver also felt pressure. December futures dropped 0.24% to $48.586. These movements suggest changes in market sentiment and demand for safe-haven assets.
Understanding the Numbers Behind Recent Price Action
Technical stats show key price levels. Support sits at $4,096-4,060, with crucial support at $3,870. Resistance is at $4,174-4,210.
Analysts predict a trading range of $3,970-$4,280 this week. This $310 range represents about 8% volatility. For gold, that’s a substantial amount of price movement.
| Level Type | Price Range | Significance |
|---|---|---|
| Immediate Support | $4,096 – $4,060 | Short-term buying zone |
| Critical Support | $3,870 | Make-or-break level |
| Resistance Zone | $4,174 – $4,210 | Selling pressure expected |
| Weekly Range | $3,970 – $4,280 | Expected trading boundaries |
Visual Trends Over the Last Decade
Gold’s journey from 2015 to 2025 is striking. It started around $1,050-1,100 in late 2015. The metal then slowly recovered, reaching $1,300-1,500 between 2016-2019.
2020 brought dramatic change. COVID-19 pushed gold past $2,000 for the first time. It peaked at $2,070 per ounce in August 2020.
Gold then frustrated investors by moving sideways. It stayed between $1,700-2,000 for much of 2021-2023. This consolidation tested patience and shook out weaker investors.
2024 saw renewed momentum. Gold broke above $2,100, then $2,200, pushing towards $2,400-2,500 by mid-2024. Early 2025 brought further gains. Recent forecasts suggest this rally may continue despite corrections.
A decade-long graph would show an ascending channel with volatility. You’d see the COVID spike, 2021-2023 consolidation, and 2024-2025 parabolic move. Each phase reflects external events and investor psychology.
The gains over this period are impressive:
- 2015-2020: Approximately 97% gain (from $1,050 to $2,070)
- 2020-2023: Consolidation phase with -15% to +10% fluctuations
- 2023-2025: Nearly 100% gain (from roughly $2,000 to $4,100+)
- Overall decade: Approximately 290% total return
Recent Volatility in the Market
Recent gold price swings have been rapid and large. Gold climbed for two months, reaching records. It then dropped as the US dollar rebounded.
Improved US-China trade relations reduced safe-haven demand. This triggered profit-taking. Gold fell 1.3% in one session, trading near $4,058 as selling increased.
Volume analysis shows increased trading during both ups and downs. FOMO buying drove the rally. Profit-taking and stop-losses accelerated the correction. This pattern often occurs in gold’s long-term uptrends.
Indian markets showed similar trends. Gold futures settled at Rs 1,23,451 per 10 grams, down 0.53%. Silver traded at Rs 1,47,470 per kilogram, down 0.70%.
This volatility is significant given gold’s past stability. The $310 weekly range offers both opportunity and risk. Understanding these fluctuations helps investors make informed decisions.
The data shows a market in transition. Gold has broken out of its multi-year range. Its new, higher trading range depends on factors like dollar strength and geopolitical tensions.
Reliable Sources for Gold Price Information
Tracking precious metals requires reliable price data. Accurate sources can save you hundreds of dollars per trade. Let’s explore the best places to find gold price information.
Professional News Platforms
Reuters and Bloomberg offer live gold spot prices with institutional-grade accuracy. They provide direct feeds from major exchanges like COMEX and LBMA. Kitco News specializes in precious metals coverage with real-time pricing and expert analysis.
For regional markets, PAVE.com.pk offers localized pricing data. Moneycontrol and Zee Business cover MCX futures and international benchmarks. They feature insights from analysts like Manoj Kumar Jain of Prithvi Finmart.
Research and Market Analysis
The World Gold Council publishes quarterly reports that go beyond simple pricing. Their “Gold Demand Trends” reveals supply chains, central bank activity, and investment flows. CPM Group and Metals Focus produce annual surveys with forecasts based on fundamental data.
For daily checks, use exchange data or Kitco. Cross-reference significant moves across multiple platforms for accuracy. Dive into World Gold Council reports when planning longer-term positions.
Remember to check timestamps on weekend quotes. Markets close, but some websites may show Friday’s numbers as current.
FAQ
What is measured in ounces when talking about gold prices?
Gold prices are quoted in troy ounces, not regular avoirdupois ounces. A troy ounce equals 31.1035 grams, while a standard ounce is 28.35 grams. When you see a gold price of ,137, that’s for one troy ounce.
This measurement dates back to the Roman monetary system. It’s been the global standard for precious metals for centuries. Gold bullion prices worldwide use troy ounces, though dealers may show weights in grams or kilograms too.
How are gold bullion rates today established daily?
Gold trades nearly 24 hours a day across global markets. The spot price comes from the most active near-term futures contract on COMEX. The London Bullion Market Association (LBMA) publishes benchmarks twice daily through an electronic auction.
These LBMA Gold Prices are reference points for physical gold transactions worldwide. Local markets factor in currency rates, import duties, and demand. When checking live prices, note the timestamp and source for accuracy.
Why is there a difference between spot price and what dealers charge?
There’s always a premium over spot price when buying physical gold. This covers minting costs, distribution, dealer markup, and sometimes collectible value. Premiums typically range from 3-10% over spot, depending on the product.
Coins usually have higher premiums than bars. Smaller denominations cost more per ounce than larger ones. Popular coins like American Eagles have lower premiums due to high volume. During high demand, premiums can spike significantly.
What causes significant gold price fluctuations in short periods?
Several factors drive sharp gold price movements. Geopolitical events create immediate safe-haven demand. Federal Reserve announcements about interest rates can swing gold dramatically. Dollar strength has an inverse relationship with gold prices.
Inflation data releases impact gold because it’s viewed as an inflation hedge. Profit-taking can cause corrections after rallies. Technical factors like stop-loss orders can accelerate price moves in either direction.
Is now a good time to invest in gold given recent price levels?
Timing the market perfectly is nearly impossible. Gold recently hit record highs before correcting. If you’re looking at gold as portfolio insurance, a 5-10% allocation makes sense regardless of current price.
Dollar-cost averaging is a smart approach. Buy smaller amounts regularly rather than timing a single entry point. Current analysis shows gold testing support around ,096-4,060. The crucial “make-or-break” level is at ,870.
How much of my portfolio should be allocated to gold and precious metals?
Most advisors suggest 5-15% maximum in precious metals for a balanced portfolio. Gold provides diversification and risk mitigation during specific market conditions. Portfolios with 5-10% gold exposure had lower drawdowns during crises compared to stock/bond-only portfolios.
Your specific allocation depends on risk tolerance, time horizon, and financial goals. Conservative investors nearing retirement might lean toward the higher end. Younger, aggressive investors might stick to 5% or skip gold entirely.
What’s the difference between 24k gold and other purities in terms of pricing?
24k gold is 99.9% pure and sets the standard for investment-grade bullion. Lower purities like 22k (91.7% pure) and 18k (75% pure) are common in jewelry. Pricing scales with purity – 18k gold is worth 75% of 24k gold’s price.
Jewelry carries additional costs for craftsmanship and design. For investment, stick with 24k or high-purity products where you’re mainly paying for gold content. American Eagles at 91.67% pure are also popular for investing.
Are gold ETFs as good as owning physical gold?
Gold ETFs offer advantages like instant liquidity, no storage concerns, and lower transaction costs. You can invest smaller amounts easily. However, you don’t actually possess the gold – you own shares representing gold held in vaults.
Physical gold provides tangible security but comes with premiums, storage challenges, and lower liquidity. A hybrid approach works well: hold most in ETFs for efficiency, plus some physical gold for security.
How accurate are expert predictions for future gold prices?
Gold price predictions are notoriously difficult. Short-term forecasts based on technical analysis tend to be more accurate than long-term fundamental predictions. They identify probability zones rather than specific outcomes.
Long-term predictions are shakier but useful for scenario planning. Use expert forecasts as one input among many, not as absolute truth. Even strong trends can experience sharp reversals, making any prediction subject to error.
Does gold always go up during economic crises or recessions?
Gold’s response to crisis is nuanced. It can initially dip due to panic selling before rallying strongly. The sustained rally typically comes after central banks cut rates and implement stimulus measures.
Gold’s performance varies based on the specific circumstances of each crisis. It provides valuable insurance and tends to outperform during major economic dislocations. However, the timing and magnitude of its rise can differ significantly.
Which is better for investment: gold or silver?
Gold and silver serve different purposes in a portfolio. Gold is primarily a monetary metal and store of wealth. Silver has dual nature as both a monetary and industrial metal.
Gold is less volatile and easier to store significant wealth. Silver is more volatile with larger price swings. Most investors should emphasize gold (75-80% of metals position) with silver providing additional diversification.
How do I verify I’m getting accurate live gold spot prices?
Cross-reference at least two or three independent sources like Kitco.com, BullionVault, and Bloomberg. Check the timestamp carefully – some websites show delayed prices outside active trading hours.
Understand bid-ask spreads and be skeptical of dealer websites showing prices far from benchmarks. For official settlement prices, go directly to exchange sources like CME Group’s website for COMEX data.