
Standard Chartered Bank forecasts a surge in gold prices. They predict $4,300 per ounce in three months and $4,500 in a year. This forecast signals major shifts in the precious metals market.
I’ve analyzed gold charts and patterns for years. These movements reveal stories about economic cycles, human psychology, and the eternal dance between fear and confidence in global markets. Gold price history offers practical knowledge for investors.
It helps in making smart decisions about wealth protection and growth. This information is valuable for both seasoned and new investors alike.
This article presents data, analysis, and expert projections on gold’s enduring appeal. We’ll explore why tracking gold market trends is crucial for portfolio diversification. You’ll gain insights into this metal’s centuries-long value retention.
Key Takeaways
- Standard Chartered forecasts this precious metal reaching $4,300-$4,500 per ounce within the next year
- Understanding historical patterns helps investors make informed decisions about portfolio diversification
- Market movements reflect broader economic cycles and investor sentiment shifts
- This asset has maintained its value across centuries as a reliable store of wealth
- Current projections suggest significant upward momentum in the precious metals market
- Tracking trends combines statistical analysis with understanding human behavior and global economics
Overview of Gold Price History
Gold’s price history reflects human fear, economic upheaval, and the quest for stability. It reveals patterns that explain gold’s appeal across millennia. These patterns help investors make better decisions, avoiding emotional reactions to short-term swings.
Understanding historical trends provides practical knowledge for investing. It shows how gold behaves during different economic conditions. This insight can guide more informed investment choices.
Importance of Gold as an Asset
Gold serves multiple roles in finance, making it unique among investments. Its combination of qualities explains its enduring appeal. These features make gold a valuable addition to many portfolios.
As a hedge against inflation, gold often maintains value when currencies weaken. During high inflation, investors turn to gold for protection. In the 1970s crisis, gold prices soared from $35 to $850 per ounce.
Gold acts as a safe haven during crises. It typically performs well when other assets struggle. This pattern is clear in decades of market data. During the 2008 financial crisis, gold rallied while stocks fell.
Gold helps with portfolio diversification due to its low correlation with stocks and bonds. It often moves independently or inversely to stock markets. Adding gold can reduce overall portfolio volatility. Experts suggest 5-10% allocation to precious metals.
Historical Trends and Milestones
Key moments in history have redefined gold’s role in the global economy. These shifts changed how we value gold. They mark important turning points in the precious metal’s investment history.
The gold standard linked currencies directly to gold reserves. This system was stable but inflexible. It eventually proved incompatible with modern economic management.
In 1971, the Nixon Shock ended the dollar’s tie to gold. This decision allowed central banks more flexibility in monetary policy. It marked the start of modern gold price history.
The 1980 price spike saw gold reach $850 per ounce. This surge was driven by geopolitical tensions and high inflation. It shows gold’s potential during extreme market conditions.
A long bear market followed from 1980 to 2001. Gold prices fell as inflation decreased and interest rates stabilized. Investors favored stocks during the dot-com boom.
| Period | Price Movement | Primary Drivers | Peak Price |
|---|---|---|---|
| 1971-1980 | +2,300% | Inflation, geopolitical crisis, dollar weakness | $850/oz |
| 1980-2001 | -70% | Disinflation, strong dollar, stock market boom | $255/oz (low) |
| 2001-2011 | +650% | Financial crisis, quantitative easing, dollar decline | $1,921/oz |
| 2024 Rally | +30% (9 weeks) | Central bank buying, geopolitical uncertainty | $4,381.52/oz |
From 2001 to 2011, gold prices surged from $255 to $1,921 per ounce. This rally coincided with the financial crisis and unprecedented stimulus programs. Investors who had long ignored gold rushed to add it to their portfolios.
Recently, gold rallied 30% in nine weeks, reaching $4,381.52 per ounce. This surge surprised many but aligned with increased central bank purchases. For future price insights, check this gold price prediction 2024 resource.
Key Factors Influencing Gold Prices
Several factors consistently drive gold prices. Understanding these mechanisms helps explain gold’s market behavior. These influences shape both short-term fluctuations and long-term trends.
Real interest rates have an inverse relationship with gold prices. Low or negative real rates make gold more attractive. High rates favor interest-bearing assets. This pattern is evident in gold’s price history.
The dollar’s strength affects gold prices globally. A stronger dollar makes gold more expensive for international buyers. A weaker dollar stimulates gold purchases. This inverse correlation is a reliable trend.
Key factors that consistently impact gold prices include:
- Inflation expectations – Rising inflation fears drive investors toward gold as a store of value
- Geopolitical uncertainty – Wars, trade disputes, and political instability increase safe haven demand
- Central bank policies – Monetary easing programs and reserve diversification affect prices significantly
- Currency devaluation concerns – Fears about paper money losing value boost gold appeal
- Mining supply constraints – Limited new production can support higher prices during strong demand
Central bank gold purchases have become increasingly important recently. The freezing of Russian assets in 2022 accelerated this trend. Many countries now buy gold as a politically neutral reserve asset.
This shift in central bank behavior changes demand patterns. Unlike individual investors, central banks accumulate gold steadily. Their consistent purchases provide ongoing support for gold prices.
Physical gold market dynamics also influence prices. Mine production has stayed flat while demand grows. This imbalance supports higher long-term prices, despite short-term volatility.
Graphical Representation of Gold Prices
Visual charts make understanding gold price fluctuations easier. They transform raw numbers into clear narratives. Seeing peaks and valleys helps spot patterns that spreadsheets can’t show.
Charts reveal stories in the data over time. You can see panic spikes during crises and steady climbs in inflationary periods. They also show frustrating sideways markets where prices stagnate for years.
Interactive Price Chart
The best gold price charts are interactive tools. They let you explore data from multiple angles. Key features go beyond the obvious ones.
Quality tools let you control the timeframe you’re viewing. You should be able to zoom from decades to individual trading days. Adding technical indicators turns a simple chart into a powerful analytical tool.
Great charting tools have these features:
- Multiple timeframe views – Switch seamlessly between intraday, weekly, monthly, and yearly perspectives
- Comparison capabilities – Overlay gold against the dollar index, stock markets, or other precious metals
- Inflation adjustment toggle – View both nominal and real (inflation-adjusted) prices
- Export functionality – Download data for your own analysis
- Mobile responsiveness – Access your charts anywhere without losing functionality
Many financial websites offer free interactive charts. Find one that matches your style and master its features.
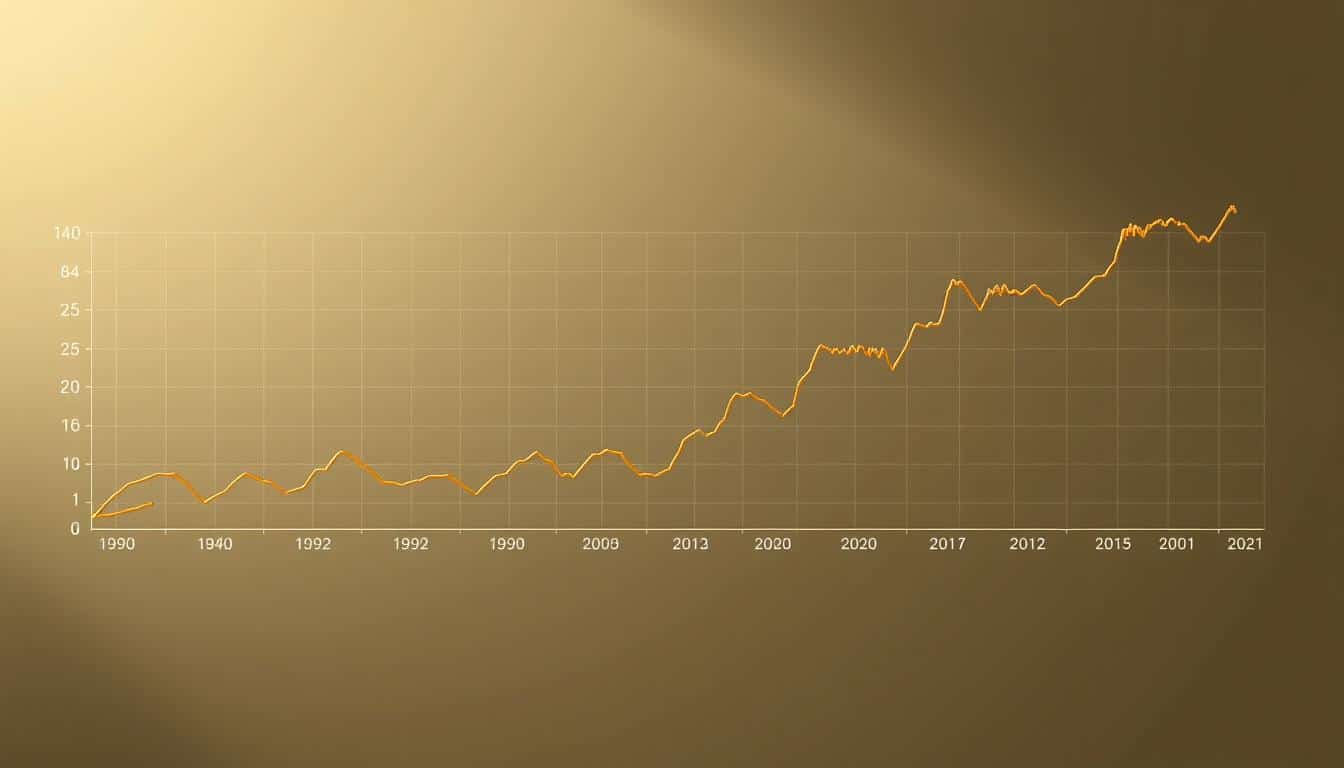
Long-term Price Trends
Long-term gold price charts reveal fascinating patterns. They show gold’s relationship with economic conditions over decades. These patterns repeat consistently, though never exactly the same.
Gold prices stagnated from 1980 to 2000. Then, they quintupled from 2000 to 2011, reaching over $1,900 per ounce.
Inflation-adjusted prices tell an even more interesting story. The 1980 peak was higher in real terms than 2011. Gold only surpassed its historical purchasing power peak in the 2020s.
| Period | Price Movement | Driving Factors | Duration |
|---|---|---|---|
| 1970s Bull Market | $35 to $850 | Inflation, end of gold standard, geopolitical uncertainty | 10 years |
| 1980-2000 Bear Market | $850 to $250 | Strong dollar, disinflation, central bank selling | 20 years |
| 2000-2011 Bull Market | $250 to $1,900 | Financial crisis, quantitative easing, weak dollar | 11 years |
| 2011-2015 Correction | $1,900 to $1,050 | Recovery optimism, rising interest rates expectations | 4 years |
| 2015-Present Rally | $1,050 to $4,300+ | Economic uncertainty, negative real rates, pandemic response | 9+ years |
These long-term cycles provide context for current market conditions. Knowing if gold is in a bull or bear market changes how you interpret short-term movements.
Short-term Volatility
Short-term volatility is where most investors experience price fluctuations. Day-to-day and week-to-week swings can be nerve-wracking if you’re not prepared.
Gold doesn’t move in straight lines. Even during strong bull markets, sharp pullbacks test your conviction. Recent analysis shows this normal market behavior.
After hitting a record peak, gold experienced a “healthy correction”. The projected 5-10% decline is typical after a 30% rally. Markets need to consolidate gains before the next upward move.
Here’s what to know about short-term volatility:
- Context matters – A 5% drop after a 30% rally is different than a 5% drop at the start of a downtrend
- Volume tells the story – Heavy volume on down days suggests distribution; light volume suggests healthy profit-taking
- Support levels act as safety nets – Previous resistance often becomes new support during corrections
- Time heals volatility wounds – What looks scary on a daily chart often disappears on a weekly or monthly view
Effective gold chart analysis combines long-term trends and short-term movements. See both the forest and the trees. Understand multi-year direction without panicking over normal weekly fluctuations.
Statistical Analysis of Gold Prices
Gold’s performance reveals more than simple price charts. Statistical analysis uncovers patterns that casual observation misses. The numbers show gold’s resilience and volatility, often simultaneously.
Statistics remove emotional reactions and market hype. They reveal what actually happened, not what people remember. This section breaks down gold’s price history using data-driven methods.
Annual Average Prices
Annual average prices smooth out daily noise in gold performance. They reveal genuine trajectories, not temporary spikes or crashes. This approach filters out panic and shows sustained trends.
Key years provide concrete reference points. In 1970, gold averaged $35 per ounce. By 1980, it hit $615, with a January peak of $850.
2000 marked a turning point at $279 per ounce. From there, prices surged upward. In 2011, gold averaged $1,572, reflecting post-financial crisis demand.
In 2020, gold averaged $1,770 during pandemic uncertainty. 2024 data shows averages above $2,300, with November peaks reaching $4,381. These numbers represent shifts in gold’s value relative to other assets.
Annual averages help identify real trend changes versus temporary volatility. A weak quarter matters less if yearly averages still show growth. This perspective keeps you grounded in chaotic markets.
Price Fluctuations Over Decades
Decade-by-decade analysis reveals patterns spanning economic cycles. Each ten-year period tells a unique story. Compound annual growth rates (CAGR) provide a statistical framework for each decade.
The 1970s were gold’s most explosive decade. Starting at $35 and ending near $850, gold grew 37% annually. This coincided with the gold standard’s end and accelerating inflation.
The 1980s and 1990s saw decline. Gold fell from $850 to $400 in the 80s, then below $300 by 2000. Strong economic growth and booming stocks made gold seem irrelevant.
The 2000s brought gold’s comeback. From $279 in 2000 to $1,410 in 2010, gold achieved 17% CAGR. Economic crises reminded investors of gold’s value as insurance.
The 2010s showed consolidation and renewal. Gold peaked at $1,900 in 2011, then declined until 2019. The decade ended at $1,515, delivering 1.5% CAGR.
The current decade has shattered records. From $1,515 in 2019 to $4,381 in November 2024, gold soared. The U.S. dollar weakened 9% year-to-date, supporting gold prices.
| Decade | Starting Price | Ending Price | Approximate CAGR | Key Drivers |
|---|---|---|---|---|
| 1970s | $35 | $850 | +37% | End of gold standard, inflation surge |
| 1980s | $850 | $400 | -6% | Volcker rate hikes, disinflation |
| 1990s | $400 | $279 | -3.5% | Tech boom, strong dollar, central bank selling |
| 2000s | $279 | $1,410 | +17% | Financial crisis, quantitative easing |
| 2010s | $1,410 | $1,515 | +1.5% | Consolidation, then rate cut expectations |
These decade-level statistics provide context for current prices. Understanding gold’s wide range of returns helps set realistic expectations. Both -3% and +37% annual returns are possible over extended periods.
Inflation-Adjusted Gold Prices
Inflation adjustment reveals gold’s real purchasing power over time. The results might surprise you. A dollar today doesn’t buy what it did in 1980.
Gold’s $850 peak in 1980 equals roughly $3,200 in 2024 dollars. This means the 2024 peak of $4,381 surpasses the 1980 record in real terms.
The distinction between nominal and real prices is crucial. Since 1970, gold has risen 114-fold in nominal terms. In real terms, the gains are more modest but still substantial.
Gold’s 2011 peak of $1,900 equals about $2,550 in 2024 dollars. Current prices above $2,300 approach but don’t exceed that high. The recent surge past $4,000 changes this.
Gold has preserved purchasing power well. However, it’s not the explosive real-return generator that nominal prices suggest. Its primary function remains wealth preservation rather than aggressive growth.
Current market dynamics support gold prices. The dollar’s 9% decline reduces gold’s opportunity cost for international buyers. The Federal Reserve’s rate cuts make gold more attractive compared to bonds.
Gold earns no interest or dividends. This disadvantage shrinks as rates fall toward 4% or lower. The gap between holding gold and Treasury bonds narrows, increasing gold’s appeal.
Inflation-adjusted prices help evaluate gold’s relative value. At $2,400, gold is high nominally but not unprecedented in real terms compared to previous peaks.
These statistical frameworks transform price fluctuations into interpretable data. You gain quantitative understanding instead of vague impressions. This knowledge is crucial for making informed investment decisions.
Influencing Factors on Gold Prices
Gold market trends are shaped by economic, political, and physical realities. These factors can be analyzed to understand price movements. Once you grasp the underlying mechanics, gold becomes more predictable.
Three main categories drive changes in gold value over time. Economic indicators provide the mathematical foundation. Geopolitical events create volatility. Supply and demand dynamics establish physical constraints.
Economic Indicators and Gold Prices
Real interest rates are crucial in precious metal investment history. When real rates fall, gold typically rises. This happens because the cost of holding it decreases.
Gold and the dollar index usually have an inverse relationship. When the dollar weakens, gold becomes cheaper for foreign buyers. This year’s 9% dollar decline has created favorable conditions for gold appreciation.
The Fed’s rate decisions impact gold markets quickly. Rate cuts make non-yielding gold more attractive. The current rate-cutting cycle has boosted gold’s recent strength.
Moderate inflation often correlates positively with gold prices. Investors seek protection during these times. Extreme deflation or hyperinflation also drive gold purchases for different reasons.
GDP growth rates have a complex connection to gold values. Strong economic expansion can pressure gold. Yet sustained growth with inflation fears often supports gold as portfolio insurance.
Geopolitical Events Impacting Value
The 2022 Russian asset freeze changed central bank behavior worldwide. It accelerated de-dollarization efforts across emerging markets. This event showed the risks of dollar-denominated reserves to other nations.
Emerging market central banks increased gold purchases as a safeguard. This was strategic repositioning based on new geopolitical risk understanding. The impact on gold market trends has been substantial and sustained.
Historical events show gold’s response to political upheaval. The 1979 Iranian revolution drove gold to $850 per ounce. The 2008 financial crisis started gold’s decade-long bull market.
Brexit created volatility spikes in currency markets. COVID-19 triggered monetary stimulus that benefited gold. Each crisis teaches that uncertainty drives investors toward tangible assets.
Political uncertainty under Trump raised concerns about U.S. debt sustainability. Trade policy shifts and Fed pressure created “renewed political risk” in America’s economic management. These are quantifiable risk factors for institutional investors.
Supply and Demand Dynamics
Gold production constraints limit how quickly supply responds to price changes. Global mine production is about 3,000 tons annually. This figure grows slowly and predictably over decades.
Recycling adds roughly 1,200 tons to annual supply. Volumes rise when prices climb and fall when they decline. This creates a natural stabilizing mechanism in markets.
Central bank buying versus selling has changed dramatically. Banks were net sellers for decades but became net buyers around 2010. This trend has accelerated recently, with emerging market central banks leading purchases.
Jewelry demand, mainly from India and China, accounts for about 50% of total gold demand. Cultural factors drive consistent consumption. Price sensitivity exists but cultural significance often overrides economic calculations in these markets.
Investment demand through ETFs and physical holdings creates short-term price volatility. Institutional and retail ownership remains relatively low despite gold’s strong performance. This suggests room for further gains if mainstream adoption increases.
Supply constraints and demand growth explain gold’s upward trend over decades. You can’t manufacture gold—you can only extract what exists. Meanwhile, global wealth expands, creating more potential buyers.
| Factor Category | Primary Drivers | Impact Speed | Market Correlation |
|---|---|---|---|
| Economic Indicators | Real interest rates, dollar index, inflation | Immediate to weeks | Strong inverse (rates), strong inverse (dollar) |
| Geopolitical Events | Conflicts, sanctions, political uncertainty | Hours to months | Variable but typically positive |
| Supply/Demand | Mine production, central bank buying, jewelry demand | Months to years | Moderate positive (demand increases) |
| Monetary Policy | Fed decisions, quantitative easing, currency stability | Minutes to weeks | Strong correlation with policy direction |
These interconnected factors shape gold price movements. They’re logical responses to changing conditions. With practice, you can learn to anticipate these changes.
Predictions for Future Gold Prices
Expert analyses offer insights into gold price trends. Understanding analysts’ forecasts helps frame realistic expectations. However, it’s crucial to avoid treating projections as certainties.
Forecasting gold markets requires balancing technical analysis with economic drivers. The reasoning behind projections often matters more than specific price targets.
Near-Term Market Outlook
Standard Chartered projects gold reaching $4,300 per ounce within three months. Their forecast is based on technical support levels and ongoing catalysts.
Prices could dip to between $3,945 and $4,060 before rising again. These numbers represent technical support zones where buying interest typically emerges.
Several near-term catalysts support this bullish short-term view:
- Expected Federal Reserve rate cuts: A 25-basis-point reduction would weaken the dollar and reduce opportunity costs of holding non-yielding gold
- Seasonal buying patterns: Demand typically increases ahead of Lunar New Year celebrations across Asia
- Central bank purchases: Ongoing accumulation by monetary authorities continues supporting prices
- Dollar weakness: The greenback’s decline against other currencies makes gold more attractive internationally
Short-term gold price fluctuations are unpredictable. Temporary pullbacks after strong rallies are normal corrections. It’s important to distinguish between healthy consolidation and genuine bearish shifts.
Extended Timeline Expectations
Standard Chartered’s analysis sets a $4,500 per ounce target for the 12-month horizon. This represents significant appreciation from current levels.
Their forecast focuses on structural factors rather than cyclical ones. Bhattacharya maintains a “structurally bullish stance” based on:
- Global de-dollarization: Countries diversifying away from dollar reserves creates sustained buying pressure
- Fiscal uncertainty: Growing U.S. debt concerns and deficit spending reduce confidence in dollar-denominated assets
- Geopolitical fragmentation: Persistent tensions drive safe-haven demand beyond temporary spikes
- Central bank diversification: Monetary authorities increasingly view gold as strategic reserve diversification
A realistic range for the next 12-18 months might span from $3,800 to $5,000 or higher. This wide range reflects genuine uncertainty in the market.
The structural factors supporting higher prices aren’t temporary. De-dollarization and other trends create a supportive backdrop for sustained price appreciation.
Critical Variables and Risk Factors
Understanding potential risks is crucial. Gold market trends can reverse quickly when underlying assumptions change.
Downside risks that could pressure prices include:
- Hawkish Federal Reserve pivot: If inflation resurges and the Fed raises rates instead of cutting, dollar strength could hammer gold
- Geopolitical resolution: Peaceful settlements of major conflicts would reduce safe-haven premium significantly
- Dollar resurgence: Economic outperformance or flight-to-quality could strengthen the greenback despite fiscal concerns
- Technical breakdown: Failure to hold key support levels could trigger algorithmic selling and momentum reversal
Upside catalysts that could drive prices higher include:
- Escalating conflicts: New geopolitical crises or expansion of existing tensions
- Debt crisis concerns: Bond market instability or sovereign debt problems
- Financial system stress: Banking sector problems or credit market disruptions
- Inflation resurgence: Persistent price pressures despite central bank efforts
High prices have dampened jewelry purchases in traditional buying regions. However, dips below $4,000 would likely attract renewed buying interest.
Consensus forecasts are often wrong at inflection points. The real value lies in understanding the reasoning behind projections.
Credible forecasts acknowledge uncertainty and risk. Analysts who admit their stance could change are more trustworthy than those with absolute certainty.
Use these projections as frameworks for thinking about possible scenarios. Track key factors like Fed policy and geopolitical developments. Be ready to reassess your expectations when conditions change.
Tools for Tracking Gold Prices
I’ve tested numerous platforms for monitoring gold prices. The right tools transform how you follow gold market trends. They turn complex information into clear, actionable insights.
The best platforms combine real-time data with historical context. They give you both immediate price and the bigger picture. Let’s explore the tools that have proven their worth.
Reliable Platforms for Price Monitoring
Kitco.com has been my go-to resource for nearly two decades. It offers real-time spot prices, comprehensive charts, breaking news, and expert analysis. The platform presents data clearly with spot prices front and center.
GoldPrice.org takes a minimalist approach. It displays prices in multiple currencies simultaneously. This is useful for tracking international markets or when traveling.
BullionVault and GoldMoney integrate price tracking into their trading platforms. These excel at showing actual tradeable prices rather than theoretical spot prices. This can make a significant difference in real-world transactions.
Key features for effective gold chart analysis include:
- Real-time updates with minimal delay between market movements and display
- Historical data access spanning decades, not just recent months
- Multiple currency conversions for international perspective
- Integration with related markets like the dollar index and Treasury yields
- Customizable chart timeframes from intraday to multi-decade views
Stick with established names that have reputations to maintain. They tend to have more reliable data feeds.
Smartphone Applications for Active Investors
Most of us check gold prices on our phones now. The mobile experience has improved dramatically over the past few years. Several apps offer professional-grade features in your pocket.
The Kitco mobile app brings their website’s full functionality to iOS and Android. Gold Live! has become a favorite for its alert system. You can set price targets and receive push notifications.
The key to successful gold investing isn’t checking prices constantly—it’s having systems that notify you when action might be needed.
Major brokerage apps like E*TRADE, Fidelity, and TD Ameritrade have integrated gold tracking. These focus more on gold ETFs and mining stocks than physical gold spot prices.
Consider these factors when choosing a mobile app:
- Free apps often include ads but provide solid basic functionality
- Subscription apps ($5-15 monthly) offer advanced charting and professional tools
- Price alert customization varies widely—test before committing
- Battery usage matters if you’re running real-time updates
- Offline access to historical data can be useful during connectivity issues
Download two or three different apps and test them for a week. You’ll quickly discover which interface feels most natural for you.
Specialized Calculation and Analysis Tools
Specialized calculators help you make sense of the numbers in practical terms. They answer questions that raw price data can’t. I use these calculators weekly for deeper analysis.
Weight conversion calculators are surprisingly important when dealing with gold in different forms. They instantly show you conversions between various measurement systems. This is critical when comparing prices across different dealers or international markets.
Melt value calculators have saved me from making expensive mistakes when evaluating gold coins. They show the actual gold content value separate from any numismatic premium. This helps determine if you’re paying a reasonable price.
Inflation adjustment calculators provide fascinating perspective on gold’s long-term value. They show what gold cost in previous decades adjusted for inflation. This helps you understand whether today’s prices are historically high or low.
Portfolio tracking tools let you input your gold holdings and monitor their total value. Here’s a comparison of popular portfolio trackers:
| Tool | Best Feature | Cost | Platform |
|---|---|---|---|
| Personal Capital | Comprehensive wealth tracking | Free | Web, iOS, Android |
| GoldMoney Holding | Integrated with storage | Transaction fees | Web, Mobile |
| Mint | Automatic updates | Free | Web, iOS, Android |
| Excel/Google Sheets | Complete customization | Free | Desktop, Web |
For detailed gold investment records, I prefer a customized spreadsheet. It takes initial setup time but gives you exactly the tracking you want. You can track purchase dates, prices paid, premiums, and current values.
Online Gold Calculators offer quick math for common scenarios. They handle purity percentages and give instant answers. These are useful when evaluating jewelry or scrap gold that isn’t pure 24-karat.
Bookmark at least three different tools for your gold tracking needs. Use a primary price tracker, a mobile app with alerts, and a calculator for specialized analysis. This combination covers your bases without overwhelming you.
How to Invest in Gold
Gold can be a valuable addition to your portfolio. There are many ways to invest in gold today. Choosing the right investment method is crucial for success.
Understanding how to own gold is key. Once you grasp the basics, investing becomes easier.
Different Investment Methods
Physical gold offers direct ownership. Holding coins and bars can be reassuring. However, storage and security are important considerations.
Home safes work for small amounts. Larger holdings may need bank boxes or vault services. These options add ongoing costs.
Gold jewelry has cultural value but high markups. It’s not ideal for serious investing unless in specific markets.
Gold ETFs changed everything for regular investors. These funds track gold’s value without physical storage hassles. You buy shares that trade like stocks.
Mining stocks offer a leveraged bet on gold prices. They can outperform gold but carry more risk. You’re exposed to company-specific issues and operational challenges.
Futures and options are for sophisticated traders. They offer high-risk, high-reward exposure with leverage. Beginners should avoid these complex instruments.
Digital gold platforms let you buy fractional amounts of stored gold. You can start with as little as $1. The convenience is great, but you’re trusting a third party.
Consider “averaging in” during weak periods instead of lump-sum purchases. This approach reduces the risk of buying at market peaks. Recent analysis shows how timing affects returns.
Benefits and Risks of Gold Investments
Gold has both advantages and drawbacks. It’s important to understand both sides before investing.
The benefits are substantial and well-documented:
- Portfolio diversification: Gold typically moves differently than stocks and bonds, reducing overall portfolio volatility
- Inflation protection: Throughout gold investment records, the metal has generally maintained purchasing power during inflationary periods
- Crisis insurance: When markets crash, gold often rallies as investors flee to safety
- No counterparty risk: Physical gold doesn’t depend on any institution’s promise to pay
- Global liquidity: You can sell gold virtually anywhere in the world
Gold has risks too. It produces no yield or dividends. Your returns depend on price appreciation alone.
Storage costs for physical gold can reduce returns. Price swings can be dramatic. There’s also opportunity cost when stocks outperform gold.
Gold’s value is based on market demand. There’s no cash flow to analyze. It’s a bet on psychology and monetary conditions.
Research shows gold ownership is still relatively low. Many portfolios are underexposed compared to historical norms. This suggests potential upside as more investors recognize gold’s role.
Understanding Gold ETFs and Mutual Funds
Gold ETFs are an easy way for most investors to start. Funds like GLD and IAU have made precious metals more accessible.
These funds hold physical gold in vaults. They issue shares representing fractional ownership. One share equals a tiny slice of gold.
Key factors to evaluate in gold ETFs:
- Expense ratios: Most quality gold ETFs charge 0.25-0.40% annually—competitive but not negligible over decades
- Tracking accuracy: Check how closely the ETF follows actual gold prices, including during volatile periods
- Liquidity: Larger ETFs like GLD trade with tight bid-ask spreads, reducing transaction costs
- Physical backing: Verify the fund actually holds allocated gold, not just derivatives
Gold mining funds offer a different risk-reward profile. They own shares in mining companies instead of metal. These funds can amplify both gains and losses.
Some experts suggest a 7% allocation to gold in a balanced portfolio. Your personal allocation should reflect your unique situation and goals.
Rebalancing is crucial for maintaining your desired gold exposure. Some investors rebalance quarterly, others annually. There’s no single right approach.
Consider using allocation bands instead of fixed percentages. This reduces frequent trades while maintaining discipline.
Gold investing doesn’t require complex knowledge. It does need clear thinking about methods, costs, and portfolio fit. Understanding what you own and why is key.
FAQs about Gold Price History
Investors often ask about gold markets. Let’s address the three most common questions. These queries help people understand gold price history and make investment decisions.
What Drives Changes in Gold Prices?
Multiple interconnected factors influence historical gold prices. Real interest rates top the list. When rates minus inflation turn negative, gold becomes more attractive.
Dollar strength plays an inverse role. A weaker dollar makes gold cheaper for foreign buyers. Inflation expectations matter enormously. People buy gold when they worry about money losing value.
Geopolitical risk acts as an accelerant. Wars and crises send investors to safe havens. Central bank policies shape the landscape too.
Rajat Bhattacharya from Standard Chartered sees it differently. He says gold’s strength reflects “distrust” in traditional reserve currencies. Recent events have accelerated this shift.
How Often Do Gold Prices Fluctuate?
Gold trades nearly 24 hours a day across global markets. Prices change constantly, often second by second during active trading. The magnitude of daily movements varies depending on market conditions.
During calm periods, gold might move only $5-15 per ounce daily. This represents under 0.5% change. During stress events, gold can swing $50-100 or more in a day.
The recent 30% rally over nine weeks is unusual. Standard Chartered projects a temporary pullback of 5-10%. This would be a normal correction after such a run-up.
My advice: don’t watch daily fluctuations. It creates stress without adding value. Weekly or monthly reviews make more sense. Focus on long-term trends rather than daily noise.
Where Can I Find Reliable Gold Price Data?
Finding trustworthy information about historical gold prices requires knowing good sources. Reliable platforms include Kitco.com and BullionVault. They provide spot prices and historical charts.
The World Gold Council offers comprehensive research and data. Bloomberg and Reuters maintain professional-grade pricing feeds. Central bank publications provide official reserve data and policy insights.
Understanding different price types is crucial:
- Spot prices reflect immediate delivery and serve as the benchmark for market value
- Futures prices indicate expected delivery costs at future dates and include carrying costs
- Retail prices show what you’d actually pay to buy physical gold, including dealer premiums that typically add 3-8% above spot
Avoid random websites without clear data sources. Cross-reference prices across trusted platforms to verify accuracy. Be wary of prices that seem too good to be true.
Sources for Gold Price Data
Quality data is crucial for smart gold investments. Not all sources are trustworthy. Some have hidden agendas, while others lack proper research. Let’s explore reliable sources and why they’re trustworthy.
I’ll guide you through my trusted sources. We’ll examine why they’re dependable. Understanding where data comes from is as important as the data itself.
Reputable Market Analysis Firms
Major financial firms offer credible gold chart analysis. They employ teams dedicated to commodities research. Their reputation depends on accuracy.
Standard Chartered Bank publishes weekly commodity outlooks. Their Senior Analyst, Rajat Bhattacharya, provides transparent and in-depth analysis. His work shows reasoning and acknowledges uncertainty.
Goldman Sachs, JPMorgan, Citi, and UBS also have strong research teams. Their analysis is available through news services or directly to clients.
The World Gold Council produces rigorously researched quarterly demand trends reports. They maintain extensive databases of historical gold prices. Refinitiv aggregates pricing from multiple sources, giving a complete market picture.
Here’s what I look for when evaluating any analysis firm:
- Named analysts with verifiable credentials, not anonymous “market experts”
- Transparent methodology that explains how they reached their conclusions
- Consistent track records you can verify against historical predictions
- Acknowledgment of uncertainty rather than false precision
- Separation of data reporting from opinion and speculation
Industry Reports and Publications
Specialized resources offer deeper insights into gold market trends. Combining multiple publication types gives a more complete picture. This approach is better than relying on a single source.
CPM Group and Metals Focus publish detailed annual gold yearbooks. These break down supply-demand data with impressive detail. Academic sources like the National Bureau of Economic Research offer unbiased perspectives.
Trade publications keep you current. Mining.com and Kitco News offer daily updates on gold market trends. The London Bullion Market Association publishes official price-fixing data and market structure information.
Government sources add credibility. The U.S. Geological Survey tracks global mine production statistics. This data helps understand supply-side dynamics that influence prices.
My approach to industry publications:
- Start with free sources like trade publications and government reports
- Invest in paid reports only after you understand the basics
- Cross-reference claims across multiple publications
- Treat any single source as one piece of a larger puzzle
Online Marketplaces for Gold
Platforms with actual transactions provide real-world pricing data. Understanding retail premiums is as important as tracking spot prices. This insight helps gauge true market conditions.
APMEX, JM Bullion, and SD Bullion are major U.S. online dealers. Their listed prices reflect actual retail markets. BullionVault and GoldMoney show real-time bid-ask spreads for allocated storage.
Even eBay’s gold section offers useful market intelligence. Watching completed sales reveals demand patterns in secondary markets. Local coin shops often publish buying and selling prices online.
Understanding retail premiums is crucial:
- Expect premiums of 3-8% over spot for common bullion products
- Smaller denominations typically carry higher percentage premiums
- Premiums fluctuate based on supply constraints and demand surges
- Comparing marketplace prices to spot quotes reveals the true cost of physical investment
Don’t take anyone’s word at face value. Build your own network of trusted sources. Verify claims independently and consider potential conflicts of interest. Careful source evaluation leads to better investment decisions.
Conclusion: The Future of Gold Prices
Gold’s value isn’t predictable or always rising. However, it has stood the test of time. Its endurance makes it a unique asset in the financial world.
What the Evidence Shows
Gold’s strength reflects distrust in traditional currencies. When confidence wavers, gold’s appeal as a neutral asset grows. Standard Chartered’s analysis captures this trend.
Projected targets of $4,300 and $4,500 are credible forecasts, not guarantees. Pullbacks are normal and expected in the gold market.
Moving Forward as an Investor
Your portfolio’s gold allocation depends on personal factors. Standard Chartered suggests 7% for balanced portfolios. This offers a reasonable benchmark to consider.
Own gold based on reasoning, not panic or hype. Intentional investing is key in the gold market.
Staying Informed Without Obsessing
You don’t need to check gold prices hourly. Set alerts for significant moves and review positions quarterly. Read analysis from credible sources regularly.
Major trends in gold unfold over years, not days. Use historical context to stay grounded in data. The future is uncertain, which is why gold serves as financial insurance.